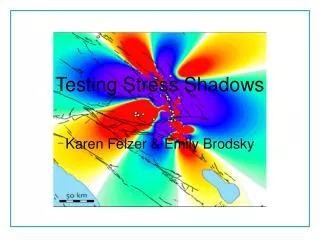
Testing Stress Shadows
Testing Stress Shadows. Karen Felzer & Emily Brodsky. If earthquake triggering is caused by static stress change, we should see stress shadows as well as zones of seismicity rate increase. Do we actually see these shadows?. Previous work on Stress Shadows.

Testing Stress Shadows
E N D
Presentation Transcript
Testing Stress Shadows Karen Felzer & Emily Brodsky
If earthquake triggering is caused by static stress change, we should see stress shadows as well as zones of seismicity rate increase. Do we actually see these shadows?
Previous work on Stress Shadows • Stress shadows observed bySimpsonandReasenberg(1994), Harris and Simpson (1998), Stein (1999), Wyss and Wiemer, (2000), Toda and Stein (2003), and others – • Marsan (2003) found that rate decreases were significantly more rare than expected. • Mallman and Zoback (2003) found little seismicity decrease after the Landers and Kobe earthquakes.
Testing for stress shadows is very difficult • If seismicity rates were low before the mainshock it’s hard to measure a rate decrease.
2. Tests for seismicity rate decreases using seismictiy rate ratios (Reasenberg & Simpson, 1992; Wyss & Wiemer, 2000…) produce many false positives
3. Tests for shadows by looking for sudden rate decreases on mainshock day (Parsons et al. 1999; Stein 1999; Wyss & Wiemer, 2000; Toda & Stein, 2003) also produce false positives if region boundaries are free
A sudden rate decrease over the entire predicted stress shadow area would be indicative - but this is never seen
What a test for stress shadows needs to do Look for a seismicity drop in any collection of spatial bins that is sharper after the mainshock than after random points in time.
To keep our spatial boundaries fluid, we look for seismicity rate changes in all 10 by 10 km bins within 1.5 fault lengths of the mainshock mainshock
To measure seismicity rate changes independent of ongoing aftershock sequences we create the time ratio statistic, R If the earthquake after the mainshock is time advanced, R<<1 If the earthquake after the mainshock is delayed, R is close to 1
Example: Evaluating rate changes after the 1990 M 5.4 Claremont Earthquake
To evaluate whether there are a significant number of rate decreases we histogram the R values for all bins Ideal histogram, infinite earthquake catalog
In finite catalogs, bins may have no post-mainshock earthquakes. Corrections result in a small hump near 1.0 even w/o a shadow
Test Sensitivity • If the concentration of R values near 1 is statistically higher after a mainshock then after a collection of random times then a stress shadow exists. • But if a significant difference is not seen we may just not have a sensitive enough test -- Type II error.
Test Sensitivity • Test sensitivity is evaluated by ensuring that a stress shadow is detected when we produce simulated catalogs using measured pre-mainshock seismicity rates, calculated static stress changes, and rate and state friction (Dieterich, 1994). Rate and state parameters
Results for Landers No shadow detected
Results for Loma Prieta No shadow detected
Results for Northridge Can’t be determined
Results for Hector Mine Can’t be determined
Mid-talk summary • No stress shadows are observed after the Landers, Loma Prieta, Northridge, or Hector Mine earthquakes. In all cases the concentration of R near 1 is less after the mainshock than at random times. • For Landers and Loma Prieta the absence is significant -- Type II error can be ruled out at 98% significance. • For Northridge and Hector Mine the data is not sufficient to rule out Type II error.
What about 1906? There were probably on the order of at least 2 times more M≥5.5 earthquakes/year in the SF Bay area from 1850-1906 as 1906-2000. But was this caused by a stress shadow?? The seismicity patterns do not fit the stress shadow model
The timing of the seismicity slow down does not agree with the stress shadow hypothesis
The location of the seismicity rate slow down does not agree with the stress shadow hypothesis
Alternate explanation for Bay Area quiescence • Since most earthquakes are aftershocks, the seismicity rate has positive feedback: high and low seismicity rates reinforce each other. • Independent of 1906, seismicity sometimes persists at a higher or lower rate. • This indicates that the SF “shadow” is a result of earthquake triggering, clustering, and statistical chance, not static stress decrease. • In this model recovery from the SF Bay quiescence will be more sudden than gradual, and unpredictable.
Inter-event times indicate that many pre-1906 earthquakes were aftershocks of each other 1000 simulated Poissonian eqs Pre-1906, M≥5.5
Simulated sequences, in which earthquake timing is determined only by Omori’s law, can produce “shadows” Simulation Results shadow
Conclusions • If aftershocks are triggered by static stress changes, stress shadows should occur. • Here we find no shadow after the Landers, Loma Prieta, Northridge, or Hector Mine mainshocks, although Type II error cannot be ruled out for Northridge and Hector Mine. • In the SF Bay Area, the instrumental earthquake catalog has been significantly quieter than the historic one. But the timing and location of the quiescence do not fit the stress shadow hypothesis, suggesting that earthquake clustering statistics may be the cause.