
rfdf d
E N D
Presentation Transcript
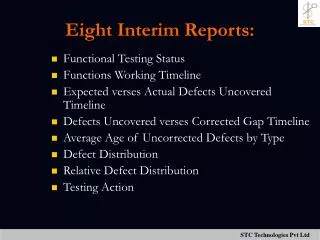
Eight Interim Reports: • Functional Testing Status • Functions Working Timeline • Expected verses Actual Defects Uncovered Timeline • Defects Uncovered verses Corrected Gap Timeline • Average Age of Uncorrected Defects by Type • Defect Distribution • Relative Defect Distribution • Testing Action
Functional Testing Status Report • This report will show percentages of the functions which have been: Fully Tested Tested With Open Defects Not Tested
Functional Testing Status Report 40 30 20 10 Fully Tested Not Tested with open defects Tested
Functions Working Timeline • This report will show the actual plan to have all functions working verses the current status of functions working. • An ideal format could be a line graph.
Functions Working Timeline 40 30 20 10 Actual Status Current Status Jan Feb Mar Timeline
Expected verses Actual Defects Detected • This report will provide an analysis between the number of defects being generated against the expected number of defects expected from the planning stage.
Expected Versus Actual Defects Detected Expected defects 40 30 20 10 Actual defects M1 M2 M3
Defects Detected verses Corrected Gap • This report, ideally in a line graph format, will show the number of defects uncovered verses the number of defects being corrected and accepted by the testing group. • If the gap grows too large, the project may not be ready when originally planned.
Defect Detected Versus Corrected Gap No Of D E F E C T S 40 30 20 10 Detected Gap Corrected Module
Average Age Uncorrected Defects by Type • This report will show the average days of outstanding defects by type (Sev 1, Sev 2, etc.). • In the planning stage, it is beneficial to determine the acceptable open days by defect type.
Average Age UnCorrected Vs Defects By Type 20 10 5 0 No Of D A Y S Critical Major Minor
Defect Distribution • This report will show the defect distribution by function or module. It can also show items such as numbers of tests completed.
Defect Distribution No Of D E F E C T S 40 30 20 10 30 20 10 M1 M2 M3
Relative Defect Distribution • This report will take the previous report (Defect Distribution) and normalize the level of defects. • An example would be one application might be more in depth than another, and would probably have a higher level of defects. • However, when normalized over the number of functions or lines of code, would show a more accurate level of defects.
Testing Action • This report can show many different things, including possible shortfalls in testing. • Examples of data to show might be number of Sev 1 defects, tests that are behind schedule, and other information that would present an accurate testing picture.
Final Test Report • Three Objectives: Define Scope of Testing Present Test Results Draw Conclusions/Recommendations