Identification of Differentially Expressed Proteins in CAD-RNAi and Wild Type Midribs
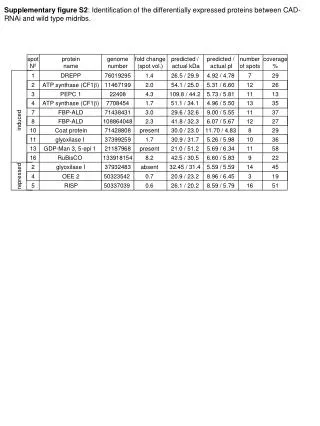
This study explores the differential expression of proteins between CAD-RNAi treated plants and wild-type midribs. We analyzed various proteins, focusing on their genomic identifiers, predicted and actual molecular weights, isoelectric points, and coverage percentages. Notable proteins investigated include ATP synthase, PEPC, FBP-ALD, glyoxylases, and RuBisCO. The findings contribute to understanding the molecular mechanisms underlying the response to CAD-RNAi treatment, shedding light on potential metabolic pathways and functional implications.

Identification of Differentially Expressed Proteins in CAD-RNAi and Wild Type Midribs
E N D
Presentation Transcript
spot Nº protein name genome number fold change (spot vol.) predicted / actual kDa predicted / actual pI number of spots coverage % 1 DREPP 76019295 1.4 26.5 / 29.9 4.92 / 4.78 7 29 2 ATP synthase (CF1b) 11467199 2.0 54.1 / 25.0 5.31 / 6.60 12 26 3 PEPC 1 22408 4.3 109.8 / 44.2 5.73 / 5.81 11 13 4 ATP synthase (CF1b) 7708454 1.7 51.1 / 34.1 4.96 / 5.50 13 35 7 FBP-ALD 71438431 3.0 29.6 / 32.6 9.00 / 5.55 11 37 induced 8 FBP-ALD 108864048 2.3 41.8 / 32.3 6.07 / 5.67 12 27 10 Coat protein 71428808 present 30.0 / 23.0 11.70 / 4.83 8 29 11 glyoxilase I 37399259 1.7 30.9 / 31.7 5.26 / 5.98 10 36 13 GDP-Man 3, 5-epi 1 21187968 present 21.0 / 51.2 5.69 / 6.34 11 58 16 RuBisCO 133918154 8.2 42.5 / 30.5 6.60 / 5.83 9 22 2 glyoxilase I 37932483 absent 32.45 / 31.4 5.59 / 5.59 14 45 repressed 4 OEE 2 50323542 0.7 20.9 / 23.2 8.96 / 6.45 3 19 5 RISP 50337039 0.6 26.1 / 20.2 8.59 / 5.79 16 51 Supplementary figure S2: Identification of the differentially expressed proteins between CAD-RNAi and wild type midribs.