Download
1 / 1
10 likes | 138 Vues
This study evaluates the atmospheric reanalysis air temperature data from ERA40, NCEP1, and NCEP2 against ground-based measurements across China, focusing on the uneven distribution of meteorological stations, particularly in western regions. Using homogenized temperatures from 731 stations, findings indicate that ERA40 air temperatures align more closely with ground measurements than NCEP1 or NCEP2. Analysis of spatial differences highlights elevation as a key factor influencing temperature discrepancies. This research underscores the need for improved representation of China's topography in reanalysis models.

E N D
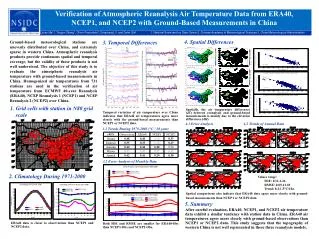
Verification of Atmospheric Reanalysis Air Temperature Data from ERA40, NCEP1, and NCEP2 with Ground-Based Measurements in China Lijuan Ma1,2, Tingjun Zhang1, Oliver Frauenfeld1, Qingxiang Li3, and Dahe Qin3 1. National Snow and Ice Data Center 2. Chinese Academy of Meteorological Sciences 3. China Meteorological Administration 4. Spatial Differences 3. Temporal Differences Ground-based meteorological stations are unevenly distributed over China, and extremely sparse in western China. Atmospheric reanalysis products provide continuous spatial and temporal coverage, but the validity of these products is not well understood. The objective of this study is to evaluate the atmospheric reanalysis air temperature with ground-based measurements in China. Homogenized air temperatures from 731 stations are used in the verification of air temperature from ECMWF 40-year Reanalysis (ERA40), NCEP Reanalysis 1 (NCEP1) and NCEP Reanalysis 2 (NCEP2) over China. 1. Grid cells with station in N80 grid scale Spatially, the air temperature differences (dT) between reanalysis and ground-based measurements is mainly due to the elevation differences (dH). Temporal variation of air temperature over China indicates that ERA40 air temperatures agree more closely with the ground-based measurements than NCEP1 or NCEP2 data. 4.1 Error Analysis 4.2 Trends of Annual Data 3.1 Trends During 1979-2001 (°C / 10 year) 3.2 Error Analysis of Monthly Data 2. Climatology During 1971-2000 Values range: SDE: 0.12-1.26 RMSE: 0.09-13.69 Trend: 0.2-1.5°C/10a. Spatial comparisons also indicate that ERA40 data agree more closely with ground-based measurements than NCEP1 or NCEP2 data. 5. Summary After careful evaluation, ERA40, NCEP1, and NCEP2 air temperature data exhibit a similar tendency with station data in China. ERA40 air temperatures agree more closely with ground-based observations than NCEP1 or NCEP2 data. This study suggests that the topography of western China is not well represented in these three reanalysis models. ERA40 data is closer to observations than NCEP1 and NCEP2 data. Both SDE and RMSE are smaller for ERA40-Obs than NCEP1-Obs and NCEP2-Obs.