
N10
Figure 1: This map shows the four analyzed basins of the Ande Mountains of South America as well as the 21 swaths taken perpendicular to the range. Both basins and swaths were analyzed for precipitation data . . N1. N2. N3. N4. N5. N6. N7. N8. N9. N10. N11. N12. N13. N14. N15.

N10
E N D
Presentation Transcript
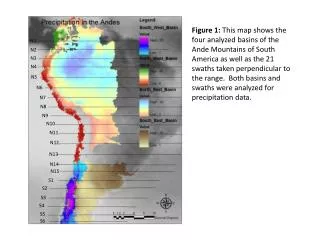
Figure 1: This map shows the four analyzed basins of the Ande Mountains of South America as well as the 21 swaths taken perpendicular to the range. Both basins and swaths were analyzed for precipitation data. N1 N2 N3 N4 N5 N6 N7 N8 N9 N10 N11 N12 N13 N14 N15 S1 S2 S3 S4 S5 S6
Figure 2: Hypsometric plot of precipitation for the four basins within the Ande Mountains.
Figure 3: Precipitation changes with latitude in the Ande Mountains. Data displayed West to East in mm/hr. Swaths run from North(N1) to South (S6).
Figure 4:Graph indicating the elevation of the glacial snow line with Latitude throughout the Andes Mountain Range from 10oN to 55oS.