Download
1 / 19
190 likes | 277 Vues
Explore the challenges in measuring and understanding residential segregation through spatial and temporal perspectives, focusing on spatial measures and trajectories. Learn about new methodologies like MASUS and trajectory analysis for a comprehensive analysis.

E N D
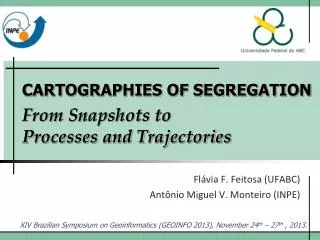
CARTOGRAPHIES OF SEGREGATIONFrom Snapshots to Processes and Trajectories Flávia F. Feitosa (UFABC) Antônio Miguel V. Monteiro (INPE) XIV Brazilian Symposium on Geoinformatics (GEOINFO 2013), November 24th – 27th , 2013.
Almost 10 years ago… A Question:How to measure residential segregation? Photo: Tuca Vieira
Many challenges… • Spatial Measures: able to go beyond the limits of areal units • Capture Different Scales of Segregation
Evenness/Clustering: Balance of the population groups distribution Exposure/Isolation: Chance of having members from different groups living side-by-side Many challenges… • Spatial Measures: able to go beyond the limits of areal units • Capture Different Scales of Segregation • Global and Local Measures • Interpretation of Measures / Validation: random permutation tests • Different Dimensions of Segregation Reardon and O’Sullivan (2004)
EVENESS/CLUSTERING: DISSIMILARITY INDEX SLIDE: Fred Ramos
EXPOSURE/ISOLATION: ISOLATION INDEX (POVERTY) SLIDE: Fred Ramos
New challenges: From snapshots to processes… The process matters!!! Bottom-up Simulations Agent-Based Modeling
MASUS Multi-Agent Simulator for Urban Segregation
MASUS Multi-Agent Simulator for Urban Segregation
0.19 0.19 We keep monitoring processes through snapshots… ISOLATION AFFLUENT HOUSEHOLDS Real Data (2000) Initial State (1991) Simulated Data (1991-2000) 0.15
Why not Trajectories? How could we represent time-space trajectories of segregation? • We need common areal units: cellular spaces • Even with cellular spaces, is it possible to compare local segregation indices computed for different years? • Is it possible to establish typologies of segregation trajectories? Types of Trajectories: • Cell-based / Pattern-based • System-based???
CARTOGRAPHIES OF SEGREGATIONFrom Snapshots to Processes and Trajectories Flávia F. Feitosa (UFABC) Antônio Miguel V. Monteiro (INPE) XIV Brazilian Symposium on Geoinformatics (GEOINFO 2013), November 24th – 27th , 2013.
Construção de Índices Espaciais • Índice de Dissimilaridade Generalizado – • Mede a diferença entre a composição populacional local e a composição populacional da cidade como um todo • Varia entre 0 e 1 (máxima segregação) • Dimensão Dispersão/Agrupamento
Construção de Índices Espaciais • Índice de Segregação Residencial – • . • Cidade segregada: alta • Proporção da que é explicada pela • Dimensão Dispersão/Agrupamento
Construção de Índices Espaciais • Índice de Exposição do grupo m ao n - • Proporção média do grupo n nos locais onde habitam indivíduos do grupo m • Depende da composição populacional da cidade • Dimensão Exposição/Isolamento
Construção de Índices Espaciais • Índice de Isolamento do grupo m - • Caso particular do índice de exposição • Proporção média do grupo m nos locais onde habitam indivíduos do grupo m • Dimensão Exposição/Isolamento
Densidade Populacional Dados Agregados Dados Discretos X Contínuos • Vantagens dos índices baseados em densidade populacional • Evita ênfase visual a áreas pouco ocupadas (grandes polígonos)