Rubber Friction
Graph C Mu against V (glass).

Rubber Friction
E N D
Presentation Transcript
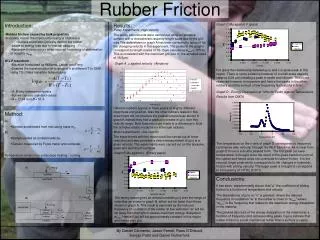
Graph C Mu against V (glass) For glass the relationship between μ(v) and v is quite weak in this region. There is some evidence however of a small scale asperity (approx 0.04 μm) creating a peak in epdm and silicone. This is not observed however in neoprene and hence the peaks in the other rubbers could be a result of low frequency fluctuations in E(w). Graph D - Energy Dissipation at 10Hz for Epdm against Temperature Results from DMTA The temperature on the x-axis of graph D corresponds to frequency (and hence also velocity) through the WLF transform. As is clear from graph D there is a double peaked form. The first peak (at lower temperature) is thought to be the result of the glass transition point of the rubber and hence does not contribute to rubber friction. It is the second, larger peak which corresponds to the changes in hysteretic friction with sliding velocity. The larger peak is thought to correspond to a frequency of 105 Hz at 20˚C. • Introduction: • Rubber friction caused by bulk properties • In Sliding friction the important property is Hysteresis • Surface asperities cyclically deform the rubber • Leads to energy loss due to internal damping • Maximum friction occurs when induced frequency of deformation is equal to wmax • W.L.F transform • Equation formulated by Williams, Landel and Ferry • Enables the transformation of a range of n at different T to 293K using TG (Glass transition temperature) • A, B vary between polymers • But we can use standard values • A = 17.44 and B = 51.6 Results: Pulley Experiments -High Velocity The pulley experiments were carried out using an abrasive surface with a characteristic asperity length scale due to the grit size.The data shown in graph A has been corrected to account for the changing velocity in the experiment. The peaks in the graphs correspond to length scales of 10-15μm (assuming wmax = 105 Hz). This is consistent with the maximum grit size in the abrasive used of 18.6μm. Rubber Friction Graph A m against velocity (Abrasive) Different rubbers appear to have peaks of slightly different magnitude and position. Also the other rubbers tested in this experiment did not produce the peaked structure as shown in graph A instead they had a gradual increase in μ(v) over this velocity range. Both features could relate to a difference in E(w) the complex elastic modulus for individual rubbers. • Method: • A) • Sample accelerated from rest using mass m2. B) • Sample pulled at constant velocity. • Tension measured by Force meter and computer. Temperature variation by subsurface heating / cooling. By Daniel Clements, Jason Farrell, Ross O’Driscoll, Sanjay Patel and Daniel Rutherford. Motor experiments - low velocity The experiments with the motor could be carried out at lower velocities and also provided a direct measurement of μ(v) at a given velocity. The experiments were carried out on the abrasive, glass and aluminium surfaces. Graph B Mu against v (Emery paper) Conclusions: It has been experimentally shown that “μ” the coefficient of sliding friction is a function of temperature and velocity. The dependence of μ(v) on “v” is greatest where the induced frequency of oscillation “w” in the rubber is close to “wmax” where “wmax” is the frequency that relates to the maximum energy dissipation in the material. The peaked structure of the energy dissipation of the material as a function of frequency and corresponding peaks in μ(v) indicate that rubber friction is a bulk mechanical rather than a surface property. The emery-paper gives an almost constant μ(v) over the range of velocities as shown in graph B, which are far lower than those shown in graph A. This result is expected as the induced frequency of oscillation of the rubber at low velocities “w” will be far away from that which causes maximum energy dissipation wmax. Hence E(w) will be approximately constant in this region and hence also μ(v).