Download
1 / 51
510 likes | 661 Vues
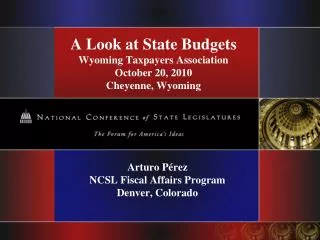
A Look at State Budgets Wyoming Taxpayers Association October 20, 2010 Cheyenne, Wyoming. Arturo Pérez NCSL Fiscal Affairs Program Denver, Colorado. Overview. State revenue performance is improving. Sizeable budget gaps loom in many states.

E N D
A Look at State BudgetsWyoming Taxpayers AssociationOctober 20, 2010Cheyenne, Wyoming Arturo Pérez NCSL Fiscal Affairs Program Denver, Colorado
Overview • State revenue performance is improving. • Sizeable budget gaps loom in many states. • States have reported a total estimated budget gap of $537.2 billion (FY 2008 through FY 2013).
Year-Over-Year Percent Real Change in Major Taxes Source: The Nelson A. Rockefeller Institute of Government. State Revenue Report, August 30, 2010.
AK ME WA MT NY WI ID WY PA IN UT NV CO CA AZ NM AL MS LA TX FL Flat n = 1 Unknown n = 1 Higher n = 9 Lower n = 40 Puerto Rico Projected FY 2010 Revenues (Compared to FY 2009 Collections) NH VT ND MN MA OR RI SD MI CT IA OH NJ NE HI IL DE WV VA MD KS MO KY NC TN OK SC AR GA Source: NCSL survey of state legislative fiscal offices, 2009.
AK ME WA MT NY WI ID WY PA IN UT NV CO CA TN AZ NM AL MS LA TX FL Flat n = 4 Higher n = 42 Lower n = 5 Puerto Rico Projected FY 2011 Revenues (Compared to Estimated FY 2010 Collections) NH VT ND MN MA OR RI MI SD CT IA OH NJ NE HI IL DE VA WV MD KS MO KY NC OK SC AR GA Source: NCSL survey of state legislative fiscal offices, March 2010
FY 2011 Total Tax Forecast(Compared to FY 2010 Collections) Not available or no response: South Dakota, Utah and West Virginia. Source: NCSL survey of state legislative fiscal offices, Summer 2010
FY 2011 Personal Income Tax Forecast (Compared to FY 2010 Collections) N/A: 7 states do not levy a personal income tax. NH and TN have limited individual income taxes. No Response: Hawaii and Utah. Source: NCSL survey of state legislative fiscal offices, Summer 2010
FY 2011 Sales and Use Tax Forecast (Compared to FY 2010 Collections) N/A: 5 states do not levy a sales tax. No Response: Hawaii and Utah. Source: NCSL survey of state legislative fiscal offices, Summer 2010
FY 2011 Corporate Income Tax Forecast (Compared to FY 2010 Collections) N/A: 4 states do not have a corporate income tax No Response: 4 states. Source: NCSL survey of state legislative fiscal offices, Summer 2010
Long-Term Tax Forecasts (Projected Total Tax Collection Growth Rate) Forecast Unavailable: FY 2012, 21 states; FY 2013, 24 states; FY 2014 29 states. No Response: California. Source: NCSL survey of state legislative fiscal offices, Summer 2010
Peak in General Fund Revenue Collections Source: NCSL survey of legislative fiscal offices, November 2009.
Projected Return to Peak Revenue Collections N/A: North Dakota Not in the current forecast horizon: 19 states No Response: 2 states Source: NCSL survey of state legislative fiscal offices, Summer 2010
AK ME WA MT NY WI ID WY PA IN UT NV CO CA TN AZ NM AL MS LA TX FL Flat, n = 6 Higher, n = 40 Lower, n = 1 FY 2011 Total Tax Forecast NH VT ND MN MA, OR RI SD MI CT IA OH NJ NE HI IL DE WV VA MD KS MO KY NC OK SC AR GA Not Available, n= 3 Source: NCSL survey of state legislative fiscal offices, 2009.
Amount Before Budget Adoption Amount After Fiscal Year Began Projected Amount State Budget Gaps FY 2002-FY 2013 (projected) No estimate Source: NCSL survey of state legislative fiscal offices, various years.
State Actions to Close Budget Gaps • Budget cuts: All programs & services subject to cuts • Tax increases • Other revenue increases • Federal stimulus funds • Wide array of other actions, many one-time in nature • Renewed focus on streamlining and efficiency
Digging for DimesIn Bull Semen and Tacos • IDEAS THAT PREVAILED • Colorado lawmakers, aiming to recoup $100 million, removed several tax exemptions and credits, including the exemptions restaurants received for the cost of purchasing condiments and take-out containers; tax breaks ranchers got when buying pesticides and bull semen; and incentives bulk mailers enjoyed for printing coupon booklets. • Wisconsin adopted “Taco Tuesday” at all state prisons, saving 10 cents a meal. • Missouri clarified that yoga and Pilates classes are recreational rather than spiritual services and subject to a sales tax. • The Wisconsin Supreme Court determined symphony tickets are subject to the sales tax since a concert is more entertainment than education. • The Oklahoma State Penitentiary cut expenses for its annual prisoner rodeo to save $120,000. • IDEAS THAT STALLED • Tennessee lawmakers defeated a proposal to tax complimentary breakfasts offered by hotels. • The Illinois Senate voted against a proposal to eliminate free bus rides for seniors. A proposal there to sell the state’s executive air fleet for $22 million also failed. • Mississippi defeated a proposal to allow some advertisements on school buses. • Illinois’ governor backed off on a proposal to collect sales taxes on Internet downloads. • California considered the sale of digital advertising space on license plates. Source: State Legislatures, September, 2010.
Failed Tax Measure • The Romanian Senate rejected a proposal to regulate and tax fortune tellers and witches. • A prominent witch had complained about potential record-keeping burdens. • One of the sponsors told the Associated Press that opposition came from lawmakers who were "frightened of having spells and curses placed on them."
Net State Tax Changes by Year of Enactment *FY 2010 figures are preliminary Source: NCSL survey of legislative fiscal offices, various years.
Net Tax Changes by Type of Tax 2009 & 2010 2010* ($4.0 Billion) 2009 ($28.6 Billion) Personal Income Tax: a decline of $629 million. *2010 figures are preliminary Source: NCSL survey of legislative fiscal offices, 2009 & 2010.
Quote of Note "All the low-hanging fruit has been eaten." Senator Joe Zarelli, Ranking Republican Member Senate Ways & Means Committee Washington
The State Budget Landscape is Mixed • Arizona: The fiscal situation appears to be stabilizing. • Maine: A small revenue surplus will begin to replenish reserves depleted during the last two years. • Ohio: In recent months year-over-year comparisons for major taxes have turned positive.
The State Budget Landscape is Mixed • Montana: The revenue decline projected in February 2010 has not declined further; however, this does not change the fact that the next Legislature will have a significant task developing the biennial budget. • Tennessee: Recent signs indicate revenues are beginning to stabilize, but state economic news continues to give mixed signals that recovery is not yet firmly underway.
The State Budget Landscape is Mixed • California: The state's fiscal situation will depend on whether the legislature and governor reach agreement on long-term fiscal reform or restructuring. • Colorado: The budget shortfall for FY 2012 could be as high as $1 billion (14 percent). • Illinois: For many reasons, both financial and political, the fiscal situation is tenuous at best.
Quote of Note "The hole is so deep and the options so few, that even if tax collections tick up a bit, it's probably like drowning in 5,000 feet of water instead of 5,050 feet -- you don't really feel much difference." Jack Hailey Senate Committee on Human Services California
Summary Comment of Note • Iowa: Officials are cautiously optimistic. Income and sales taxes dipped to very low levels and until the state experiences job growth, they will be slow to recover. The climb back to previous levels will take a long time.
Summary Comment of Note • Hawaii: We are cautioumistic.
Key Concerns Looking Ahead • Replacing federal stimulus funds • Feasibility of further budget cuts • Length of time before revenues bounce back • Feasibility of raising more revenues • Mounting spending pressures • New, ongoing and deeper structural budget gaps
Total State Tax Collections 1989-2010 Recession Source: U.S. Census Bureau
State Elections 2010 No 2010 Elections, n=4 House Only, n=3 Governor Election, n=37
State Legislatures 2010 Republican, n=14 Democrat, n=27 Split, n=8 Nonpartisan, n=1
State Legislative Battlegrounds 2010 Republican Democrat, n= 15 Split, n=2
Conclusion • State revenues are starting to show growth. • Many forecasts offer little room for error. • States face at least two more years of budget gaps. • Few states have concrete plans to address the end of federal stimulus funding. • The new political landscape will shape state actions to deal with budget problems.
www.ncsl.org For more information
State Government 2010 Republican, n=8 Democrat, n=16 Split, n=25 Nonpartisan, n=1
Democrat, n=19 Republican, n=17 Governor Elections 2010 Independent, n=1 Open, n=24
Year-Over-Year Percent Real Change in Total State Tax Collections 1990-2010 Recession Source: U.S. Census Bureau
AK ME WA MT NY WI ID WY PA IN UT NV CO CA TN AZ NM AL MS LA TX FL Used Spending Cuts in FY 2011, n = 5 Used Spending Cuts in FY 2010 and FY 2011, n = 30 Used Spending Cuts in FY 2010, n = 10 Puerto Rico Use of Spending Cuts as Percentage of Actions To Close FY 2010 & FY 2011 Budget Gaps NH VT ND MN MA OR RI SD MI CT IA NJ OH NE HI IL DE WV VA MD KS MO KY NC OK SC AR GA Not Applicable, n= 6 Source: NCSL survey of state legislative fiscal offices, July 2010
AK ME WA MT NY WI ID WY PA IN UT NV CO CA TN AZ NM AL MS LA TX FL Used Tax Increases in FY 2011, n = 4 Used Tax Increases in FY 2010 and FY 2011, n = 9 Used Tax Increases in FY 2010, n = 12 Puerto Rico Use of Tax Increases as Percentage of Actions To Close FY 2010 & FY 2011 Budget Gaps NH VT ND MN MA, OR RI SD MI CT IA OH NJ NE HI IL DE WV VA MD KS MO KY NC SC OK AR GA Not Applicable, n= 26 Source: NCSL survey of state legislative fiscal offices, July 2010
AK ME WA MT NY WI ID WY PA IN UT NV CO CA TN AZ NM AL MS LA TX FL Used ARRA Funds in FY 2011, n = 4 Used ARRA Funds in FY 2010 and FY 2011, n = 26 Used ARRA Funds in FY 2010, n = 15 Puerto Rico Use of ARRA Funds as Percentage of Actions To Close FY 2010 & FY 2011 Budget Gaps NH VT ND MN MA, OR RI SD MI CT IA NJ NE OH HI IL DE VA WV MD KS MO KY NC OK SC AR GA Not Applicable, n= 6 Source: NCSL survey of state legislative fiscal offices, July 2010
AK ME 1.0% WA MT NY 10.6% WI 5.8% ID WY PA 3.1% IN 1.4% UT NV 6.1% CO 4.6% CA 9.4% TN, 1.9% AZ NM AL 2.2% MS 2.4% LA TX FL 3.6% No tax increase, n= 17 Increase of 5% or more, n= 7 Increase of 1% to 4.9%, n= 17 Increase of less than 1%, n= 9 2009 Net State Tax Increases as a Percentage of 2008 Tax Collections NH 4.2% VT 1.5% ND MN MA, 4.4% OR 7.9% RI, 2.1% SD MI CT, 6.0% IA OH 2.1% NJ, 3.8% NE HI 4.0% IL DE, 8.2% WV VA MD KS MO KY, 1.6% NC 4.4% OK SC AR GA Source: NCSL survey of state legislative fiscal offices, 2009.
AK ME WA 6.4% MT NY 1.8% WI ID WY PA IN UT 1.4% NV CO 1.5% CA TN, 2.9% AZ 8.2% NM 3.8% AL MS LA TX FL Increase of 1% to 4.9%, n= 7 Increase of 5% or more, n= 3 No tax increase, n= 30 Increase of less than 1%, n= 10 2010 Net State Tax Increases as a Percentage of 2009 Tax Collections (Preliminary) NH VT ND MN MA, OR RI SD MI CT IA OH NJ NE HI IL DE WV VA MD KS 5.5% MO KY NC OK 1.9% SC 1.7% AR GA Source: NCSL survey of state legislative fiscal offices, 2010.
FY 2010 Personal Income Tax Collections* Above Target, 5(01, 2) No personal income tax, 9 On Target, 14(6, 2) Below Target, 20(8, 2 ) *Compared to the latest Estimate forecast increased; forecast reduced California and New York did not provide information. Source: NCSL survey of state legislative fiscal offices, July 2010.
FY 2010 General Sales Tax Collections* No general sales tax, 5 Above Target, 15 (7 , 1 ) On Target, 13(6 , 1 ) Below Target,13(3 , 1 ) *Compared to the latest Estimate. forecast increased; forecast reduced California, Florida, New York and Washington did not provide this information. Source: NCSL survey of state legislative fiscal offices, July 2010.
FY 2011 Tax Forecast(Compared to FY 2010 Collections) Source: NCSL survey of state legislative fiscal offices, July 2010
Budget Stabilization Funds(Percentage of General Fund Appropriations) States with no budget stabilization fund: Arkansas, Kansas and Montana. No Response: California. Source: NCSL survey of state legislative fiscal offices, July 2010
Budget Stabilization Funds States with no budget stabilization fund: Arkansas, Kansas and Montana. No Response: California. Source: NCSL survey of state legislative fiscal offices, July 2010
State Year-End Balances*as a Percentage of General Fund Spending * 45 states reporting for FY 2009-FY2011. Balances for FY 2010 and FY 2011 are projections. Source: NCSL survey of state legislative fiscal offices, Various Years
AK ME 60.9% WA 26.0% MT NY WI ID 57.1% WY PA 17.6% IN 50.0% UT 15.6% NV CO 43.0% CA TN, 45.9% AZ 15.8% NM 21.0% AL 48.0% MS 39.0% LA TX FL Used spending cuts, n = 33 No Response, n = 4 Not Applicable, n = 13 Use of Spending Cuts as Percentage of Actions To Close FY 2011 Budget Gaps (preliminary) NH, 23.6% VT, 29.0% ND MN 25.4% MA, 35.0% OR RI, 64.1% SD 19.0% MI CT, 21.5% IA 41.7% OH NJ, 93.1% NE 22.6% HI 16.5% IL DE WV 33.0% VA 55.0% MD, 9.0% KS 24.0% MO 34.0% KY, 40.9% NC 36.4% OK 15.0% SC 21.5% AR GA 42.0% Source: NCSL survey of state legislative fiscal offices, July 2010
AK ME 26.0% WA 9.0% MT NY 15.6% WI ID 9.6% WY PA 5.2% IN 9.0% UT 11.0% NV 45.0% CO 9.4% CA 13.4% TN, 13.8% AZ 27.2% NM 11.0% AL 23.7% MS TX 7.8% LA 14.5% FL 5% to 9.9%, n = 10 10% to 19.9%, n = 16 0.1% to 4.9%, n = 7 More than 20% n= 8 Not applicable, n= 8; not reporting, n = 1 Pre-Enactment FY 2011 Budget Gapsas a Percentage of General Fund Budget NH 7.6% VT, 23.0% ND MN 17.1% MA, 10.0% OR RI, 13.3% MI 13.0% SD 1.5% CT, 4.1% IA 19.8% NJ, 28.0% OH 2.2% NE 6.2% HI 9.3% IL 22.2% DE, 2.6% WV 4.8% VA 13.9% MD, 17.2% KS 11.4% MO 4.5% KY, 4.5% NC 25.0% OK 18.2% SC 14.9% AR GA 5.7% Source: NCSL survey of state legislative fiscal offices, July 2010.
2009 Net Tax Changes by Type of Tax ($28.6 Billion) Source: National Conference of State Legislatures, 2009.