Preparing, Designing, Delivering Great Presentations
Preparing, Designing, Delivering Great Presentations. 1. Preparing. Reflect. What is purpose of talk? Why were you asked to speak? Audience expectations? Take aways?. Preparing. Audience. Who is audience? What is purpose of event? Why were you asked to speak? Where is it? When is it?.


Preparing, Designing, Delivering Great Presentations
E N D
Presentation Transcript
Preparing Reflect • What is purpose of talk? • Why were you asked to speak? • Audience expectations? • Take aways?
Preparing Audience • Who is audience? • What is purpose of event? • Why were you asked to speak? • Where is it? • When is it?
Preparing Content • Every great presentation begins with good content..
Preparing What is your message?
Preparing Storytelling • Illustrate points with personal stories
Preparing Confidence • Know your material well
Designing Keep it simple • Slides should support speaker, supplement presentation
Designing Limit text
Designing Right amount of text
Designing High quality graphics >
Designing Use appropriate charts • Pie chart • Used to show percentages. Limit the slices to 4-6 and contrast the most important slice either with color or by exploding the slice.
Designing Use appropriate charts • Vertical Bar Chart • Used to show changes in quantity over time. Best if you limit the bars to 4-8.
Designing Use appropriate charts • Horizontal Bar Chart • Used to compare quantities. For example, comparing sales figures among the four regions of the company.
Designing Use appropriate charts • Line Chart • Used to demonstrate trends. For example, here is a simple line chart showing that our sales have gone up every year. The trend is good. The arrow comes in later to underscore the point: Our future looks good!
Designing Tables • In general, tables are good for side-by-side comparisons of quantitative data.
Designing Color • Cool – background • Blue • Green • Warm – text • Orange • Red
Designing Fonts
Designing Video + Audio
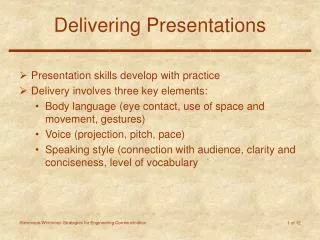
Delivering Keep it short
Delivering Use remote to move away from podium
Delivering Remember the ‘B’ Key
Delivering Keep Lights On
Delivering Be Gracious