Download
1 / 37
380 likes | 683 Vues
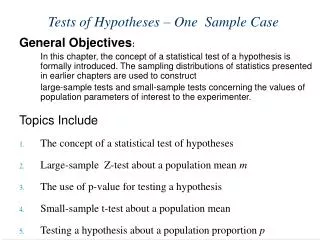
Tests of Hypotheses – One Sample Case. General Objectives : In this chapter, the concept of a statistical test of a hypothesis is formally introduced. The sampling distributions of statistics presented in earlier chapters are used to construct

E N D
Tests of Hypotheses – One Sample Case General Objectives: In this chapter, the concept of a statistical test of a hypothesis is formally introduced. The sampling distributions of statistics presented in earlier chapters are used to construct large-sample tests and small-sample tests concerning the values of population parameters of interest to the experimenter. Topics Include • The concept of a statistical test of hypotheses • Large-sample Z-test about a population mean m • The use of p-value for testing a hypothesis • Small-sample t-test about a population mean • Testing a hypothesis about a population proportion p
An Analogy of A Hypothesis Testing • Hypothesis testing is similar to a court case. It involves with the process of a decision-making based on the data information. The rule used to make the decision is based on the idea: ‘In a decision-making case, we often have two choices to choose from. We collect evidence to help us to make a decision. if the observed information is in favor of choice A, then we decide to take decision A; otherwise, we would choose decision B. Before we look into how to conduct a hypothesis test, let us go to the court to observe how a judge decides if some one is innocent or guilty. • When a criminal case goes to the court, the person is first assumed INNOCENT, and will be eventually determined as either innocent or guilty based the INFORMATION (or EVIDENCE) presented by the prosecutor and the defendant. Rules that are used by the Judge are the US LAW. • The two choices for the judge are • This person is INNOCENT or • This person is GUILTY. • At the very beginning, the person is usually ASSUMED INNOCENT.
Therefore, to simplify the discussion, we use Ho for the assumed situation, (that is: The person is assumed INNOCENT), and call it NULL HYPOTHESIS. The alternative that the prosecutor is trying to prove (The person is GUILTY) is the ALTERNATIVE HYPOTHESIS, and the notation is Ha. Based on the above discussion, Can you complete the following blanks for the court case? What are : Ho:_______________________ Ha: __________________________ What is the Decision Rule (The rule that Judge uses to make the decision): __________________________________________________________ What is the Sample Information (The information presented by prosecutor and lawyer): ________________________________________________________ Final Decision: Made by Judge, who applies the Decision Rule to the Sample Information, and decide if the person is innocent ( take Ho), or the person is guilty (take Ha) .
NOTE: It is important to understand that no matter what the final decision made by the judge, there is ALWAYS some chance of making errors. Q: There are two possible errors in this decision-making. What are they? (Hint: One type of error is: Judge decides the person is Guilty, but s/he is not guilty ) : Q: Based on the types of errors you described above,which type of error is considered more critical? That is: if the type of error was made, it would have more serious consequences. Q:The judge would like to reduce the type of more critical error, so that the judge will not have too high probability to make this critical error. In order to reduce the type of the more critical error, what suggestion(s) do you have to reduce this type of error?
A Statistical Test of Hypothesis • A statistical test of hypothesis involves four steps: 1. Set up the alternative hypothesis denoted by Ha , and the null hypothesis, denoted by H 0 2. Determine the Decision Rule and the test statistic 3. Apply the information from data to compute the observed test statistics. 4. Compare the observed test statistic with the critical value set in the Decision Rule. If the observed test statistic falls in Reject Ho Region, we reject Ho. Otherwise, we do not reject Ho. 5. State the conclusion based on the context. Definition: The two competing hypotheses are the alternative hypothesisHa, generally the hypothesis that the researcher wishes to support, and the null hypothesisH0, a contradiction of the alternative hypothesis.
The researcher then uses the sample data to decide whether the evidence favors Ha rather than H0 and draws one of these two conclusions: - Reject H0 and conclude that Ha is true. - Accept (do not reject) H0 as true. • Examples on p. 300, p. 307, and example 6.1 on p.307 show null and alternative hypotheses and the procedure of performing a test. • You can have a two-tailed test of a hypothesis or a one-tailed test of a hypothesis, a left tailed-test or a right-tailed test. • The test statistic is a single number calculated from sample data. • Either or both of these measures act as a decision maker for the researcher in deciding whether to reject or accept H0. • Example 6.1 and 6.2 and figures 6.1, 6.2 and 6.5 show acceptance and rejection regions for different type of tests • The p-value is a probability calculated using the test statistic (See Figures 6.7 and 6.8 for more examples).
A Large-Sample Test About a Population Mean • For a Right Side Test: • H0 : m=m0 Ha : m>m0 • The standard error of is calculated as • The standardized test statistic: Important points to remember: • For setting the hypothesis: The researcher’s interest, or the question asked is used to determine Ha. This is the one to determine first. • Always set Ho: m=m 0 • There are three types of tests : Right-side test: H a : m>m 0 Two-side test: H a : m¹m 0 Left-side Test: H a : m<m 0
Example: The average weekly earnings for women in managerial and professional positions is $670. Do men in the same positions have average weekly earnings that are higher than those for women? A random sample of n= 40 men in managerial and professional positions showed = $725 and s= $102. Test the appropriate hypothesis using a= .01. Solution You would like to show that the average weekly earnings for men are higher than $670, the women’s average. Hence, if m is the average weekly earnings in managerial and professional positions for men, the hypotheses to be tested are H 0 : m= 670versusH a : m> 670 (NOTE: This is a right-side test)
The rejection region for this right-side one-tailed test consists of large values of or, equivalently, values of the standardized test statistic z in the right tail of the standard normal distribution, with a= .01, which gives z= 2.33 (This is the critical value). That is, the interval of Z > 2.33 is the REJECTION REGION for the right-side test when a= .01 The observed value of the test statistic, using s as an estimate of the population standard deviation, is From the data, we observe the sample average $725. The corresponding observed z-value is 3.41, which is larger than 2.33, the critical value. Since the observed value of the test statistic falls in the rejection region, you can reject H0 and conclude that the average weekly earnings for men in managerial and professional positions are significantly higher than those for women. The probability that you have made an incorrect decision is a= .01.
The rejection region of a right-tailed test with a= .01 Decision Rule: If the observed test-statistic, zobs > 2.33 , the critical z-value, z.01, then, REJECT Ho, and in favor of Ha. If the observed test-statistic, zobs < = 2.33 , the critical z-value, z.01, then, ACCEPT Ho For this case, zobs = 3.41 > 2.33, therefore, based on the decision rule, we reject Ho, and take Ha, which means: Men’s average weekly salary is significantly higher than the female counterparts.
Another type of Hypothesis Testing is: The two-sided hypothesis is written as Ho: m=m0 Ha : m¹m0, which implies either m>m0 or m<m0.. The rejection region for a two-tailed test with a= .01 NOTE: There are two critical values: -za/2 and za/2. This is because we do not know if m>m0 or m<m0, so we will reject Ho whenever the observed average is too LARGE or too SMALL. The reject probability is totaled to a.
Summary of Large-Sample Statistical Test for m: 1. Null hypothesis: H0 : m=m0 2. Alternative hypothesis: For One-Tailed Test For Two-Tailed Test Ha : m>m0(Right-side Test)Ha : m¹m0 (or Ha : m<m0 , Left-side Test) 3. Test statistic: If s is unknown (which is usually the case), substitute the sample standard deviation s for s..
4. Rejection region: Reject H0 when One-Tailed Test Two-Tailed Test z>zaz>za/2 or z<-za/2 (or z<-za when the alternative hypothesis is Ha : m<m0) • Assumptions: The n observations in the sample are randomly selected from the population and n is large—say, n³ 30. • The following figures show right-side and two-side rejection regions:
Calculating the p-Value To avoid any ambiguity in their conclusions, some experimenters prefer to use the observed level of significance called the p-value for the test. Definition: The p-value or observed significance level of a statistical test is the tail probability beyond the observed in the REJECT region. The p-value measures the strength of the evidence against H0. • For a right-side test, the p-value of the test is actually the area to the right of the calculated value of the test statistic. p-value = P(Z > zobs) for large sample right-side test. • For a left-side test, the p-value of the test is actually the area to the left of the calculated value of the test statistic. p-value = P(Z < zobs) for large sample left-side test. • For a two-side test, the p-value of the test is actually twice of the area to the right of the absolute value of the calculated value of the test statistic. p-value = 2P(Z > |zobs|) for large sample two-side test.
P-value for a right-side test a p-value Za zobs Drawing conclusion based on p-value: If p-value < a, then we reject Ho, and take Ha. If p-value > = a, then, we do not reject Ho, and take Ho.
Example Calculate the p-value and draw your conclusion based on p-value for the test of hypothesis in the example of testing if men’s salary is significantly higher than female counterpart. Solution Since the observed value of the test statistic is z= 3.43, and it is a right-side test, so, p-value is given by: p-value =P(z >3.43)=(.5 - .4998)= .0002 Based on the decision rule using p-value, we see p-value = .0002 < a = .01. Therefore, we reject Ho, and take Ha. We conclude that Men’s average weekly salary is significantly higher than the female counterpart at a=1%. NOTE: This conclusion is the same as the conclusion using z-value. Computer software usually gives us the p-value. We use z-value to draw conclusion when there is no computer available, but a z-table or t-table is available.
Many researchers use a “sliding scale” to classify their results: - If the p-valueis less than .01, H0 is rejected. The results arehighly significant. - If the p-valueis between .01 and .05, H0 is rejected. The results are statistically significant. - If the p-valueis between .05 and .10, H0 is usually not rejected. The results are only tending toward statistical significance. - If the p-value is greater than .10, H0 is not rejected. The results are not statistically significant. In this class, the a-value will be given. In case it is not given, use a = 5%.
Use p-value to make the decision does have two advantages: - Statistical output from packages such as Minitab usually report the p-valueof the test. - Based on the p-value, your test results can be evaluated using any significance level you wish to see. • The smaller the p-value, the more unlikely it is that H0 is true! Whenever we make a decision for a hypothesis test, we are at a risk of making two types of mistakes, which are: Definition: A Type I error for a statistical test is the error of rejecting the null hypothesis when it is true. The probability of making a Type I error is denoted by the symbol a. A Type II error for a statistical test is the error of accepting (not rejecting) the null hypothesis when it is false and some alternative hypothesis is true. The probability of making a Type II error is denoted by the symbol b.
Table: illustration of the two types of errors Decision TRUTH Based on Sample Ho True Ha True Accept H0 Correct decision Type II error Reject H0 (Take Ha) Type I error Correct decision • Notice that the probability of a Type I error is exactly the same as the level of significance aand is therefore controlled by the researcher. • Keep in mind that “accepting” a particular hypothesis means deciding in its favor. • There is always a risk of being wrong, measured by a and b. Work on some hands-on activities for identifying Type I and Type II errors.
Hands-on Activities We will do some of the Extra Exercise Problems
Small-Sample Inferences Concerning a Population Mean • Small sample inference can involve either estimation or hypothesis testing. Small Sample Hypothesis Test for m : 1. Null Hypothesis: H0 : m=m0 2. Alternative Hypothesis: One-Tailed Test Two-Tailed Test Ha : m>m0Ha : m¹m0 (or Ha : m<m0) 3. Test Statistic:
4. Rejection Region: Reject H0 when One-Tailed Test Two-Tailed Test t>tat>ta/2 or t<-ta/2 (or t<-ta when the alternative hypothesis is Ha : m<m0) or when the p-value <a • Assumption: The sample is randomly selected from a normally distributed population.
Example A new process for producing synthetic diamonds can be operated at a profitablelevel only if the average weight of the diamonds is greater than .5 karat. To evaluate the profitability of the process, six diamonds are generated, with recorded weights: .46, .61, .52, .48, .57, and .54 karat. Do the six measurements present sufficient evidence to indicate that the average weight of the diamonds produced by the process is in excess of .5 karat?
Solution The population of diamond weights produced by this new process has mean m, the value in question. The hypotheses to be tested are H0 : m= .5 versus Ha : m> .5 and the test statistic is a t-statistic with (n- 1) = (6 - 1) = 5 degrees of freedom. You can use your calculator to verify that the mean and standard deviation for the six diamond weights are .53 and .0559, respectively. The calculated value of the test statistic is then As with the large-sample tests, the test statistic provides evidence for either rejecting or accepting H0 depending on how far from the center of the t distribution it lies.
If you choose a 5% level of significance (a = .05), the right-tailed rejection region is found using the critical values of t from Table 4 in Appendix I. With df=n- 1 = 5, you can reject H0 if t>t.05= 2.015. Since the calculated value of the test statistic, 1.32, does not fall into the rejection region, you cannot reject H0. The data do not present sufficient evidence to indicate that the mean diamond weight exceeds .5 karat. There are two ways to conduct a test of a hypothesis: • The critical value approach – as described in the above example. • The p-value approach. For this example, it is a right-side test: P-value = P(t > tobs) For this example, p-value = P(t > 1.32), which is larger than .05, as the graph shows.
Figure Rejection region for the above Example tobs P-value = P(t > tobs) for the right-side test. For this example, p-value = P(t > 1.32), which is larger than .05, as the graph shows.
Most statistical computing packages contain programs that will implement the Student’s t test or construct a confidence interval for m when the data are properly entered. The following example illustrates how computer can be useful for computing confidence intervals and conducting hypothesis tests. Example: For most brands of paint, a gallon will cover between 250 and 500 square feet, depending on the texture of the surface to be painted. One manufacturer claims that a gallon of its paint can cover 400 square feet of surface area. To test this claim, a random sample of ten 1-gallon cans of white paints were used to paint ten identical areas using the same kind of paint brush. The actual areas covered by these 10 1-gallon of paint are given here: 310, 311, 412, 368, 447, 376, 303, 410, 365, 350 Do the data present sufficient evidence to indicate the average coverage of this brand differs from 400 (square feet) at a = 5%?
Complete the following steps for this TWO-SIDE test: • Hypothesis: • Test-statistic: • Decision Rule: • P-value: • Conclusion: Minitab output for the Paint Example
Calculating the p-value for Paint Example Two-side t-test, p-value = 2 P(t > |tobs|). For this example , p-value = 2 P(t > 2.27) = .049 as given in the computer output. NOTE: Typically, we can not compute p-value by hand when t-test is performed. Computer comes handy for these situations.
Hands-on Activities Work on some of the extra exercise problems
A Large-Sample Test of a Hypothesis for a Binomial Proportion Large-Sample Statistical Test for p 1. Null hypothesis: H0 : p = p0 2. Alternative hypothesis: One-Tailed Test Two-Tailed Test Ha : p>p0Ha : p¹p0 (or Ha : p<p0) 3. Test statistic: where x is the number of successes in n binomial trials.
4. Rejection region: Reject H0 when One-Tailed Test Two-Tailed Test z>zaz>za/2 or z>-za/2 (or z<-za/2 when the alternative hypothesis is Ha : p<p0 ) or when p-value <a • Assumption: The sampling satisfies the assumptions of a binomial experiment and n is large enough so that the sampling distribution of can be approximated by a normal distribution(np0 > 5 and nq0 > 5).
Example Regardless of age, about 20% of American adults participate in fitness activities at least twice a week. However, these fitness activities change as the people get older, and occasional participants become nonparticipants as they age. In a local survey of n= 100 adults over 40 years old, a total of 15 people indicated that they participated in a fitness activity at least twice a week. Do these data indicate that the participation rate for adults over 40 years of age is significantly less than the 20% figure? Calculate the p-valueand use it to draw the appropriate conclusions. Solution It is assumed that the sampling procedure satisfies the requirements of a binomial experiment. You can answer the question posed by testing the hypothesis
A one-tailed test is used because you wish to detect whether the value of p is less than .2. The point estimator of p is and the test statistic is When H0 is true, the value of p is p0= .2, The sampling distribution of has a mean equal to p0 and a standard deviation of
The value of the test statistic is The p-valueassociated with this test is found as the area under the standard normal curve to the left of z= -1.25 as shown in Figure 9.10. Therefore,
p-value for the above Example (NOTE: This is a left-side test) Hands-on Activities Work on some of the Extra Exercises problems.
Some Comments on Testing Hypotheses • If the p-valueis greater than .05, the results are reported as NS—not significant at the 5% level. • If the p-valuelies between .05 and .01, the results are reported as P < .05—significant at the 5% level. • If the p-valuelies between .01 and .001, the results are reported as P < .01—“highly significant” or significant at the 1% level. • If the p-valueis less that .001, the results are reported as P < .001—“very highly significant” or significant at the .1% level.