Working With Financial Statements
Chapter Three. Working With Financial Statements. Key Concepts and Skills. Understand sources and uses of cash and the Statement of Cash Flows Know how to standardize financial statements for comparison purposes Know how to compute and interpret important financial ratios


Working With Financial Statements
E N D
Presentation Transcript
Chapter Three Working With Financial Statements
Key Concepts and Skills • Understand sources and uses of cash and the Statement of Cash Flows • Know how to standardize financial statements for comparison purposes • Know how to compute and interpret important financial ratios • Be able to compute and interpret the Du Pont Identity • Understand the problems and pitfalls in financial statement analysis
Chapter Outline • Cash Flow and Financial Statements: A Closer Look • Standardized Financial Statements • Ratio Analysis • The Du Pont Identity • Using Financial Statement Information
Balance Sheet, As of Dec 31 See 3.5: Sources & Uses of Cash
Income Statement: Jan 1 – Dec 31, 2000 Numbers are in thousands, except EPS & DPS
Sources and Uses of Cash 3.1 • Sources • Cash inflow – occurs when we “sell” something • Decrease in asset account (sell inventory, fixed assets, etc) • Increase in liability or equity account (sell a bond, common stock, etc) • Uses • Cash outflow – occurs when we “buy” something • Increase in asset account (buy inventory or fixed assets) • Decrease in liability or equity account (Redeem bonds or shares)
Statement of Cash Flows • Statement of Cash Flows – the statement that summarizes the sources and uses of cash • Changes divided into three major categories • Operating Activity – includes net income and changes in most current accounts • Investment Activity – includes changes in fixed assets • Financing Activity – includes changes in notes payable, long-term debt and equity accounts as well as dividends
Sample Statement of Cash Flows Numbers are in thousands From the B/S
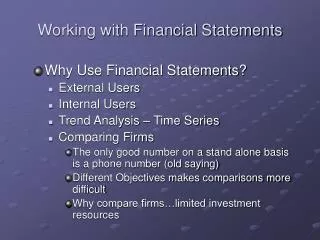
Standardized Financial Statements 3.2 • Common-Size Balance Sheets • Compute all accounts as a percent of total assets • Common-Size Income Statements • Compute all line items as a percent of sales • Standardized statements make it easier to compare financial information, particularly as the company grows • They are also useful for comparing companies of different sizes, particularly within the same industry
Common Size Income Statement: Example Income Common Size Statement Income Statement Revenue $70,134 100.0% Cost of Goods Sold $44,221 63.1% Gross Profit $25,913 36.9% SG&A $13,531 19.3% Operating Income $12,382 17.7% Interest Expense $2,862 4.1% Taxes $3,766 5.4% Net Income $5,754 8.2%
Common Size: Balance Sheet Common Size Assets Balance Sheet Balance Sheet Cash & Securities $ 6,029 15.1% Accounts Receivable $14,378 36.0% Inventory $17,136 42.9% Total Current Assets $37,543 93.9% Plant & Equipment $ 2,442 6.1% Total Assets $39,985 100%
Common Size: Balance Sheet Common Size Liabilities Balance Sheet Balance Sheet Current Liabilities $ 14,251 35.6% Long Term Debt $12,624 31.6% Total Liabilities $26,875 67.2% Shareholder’s Equity $13,110 32.8% Total Liab. & Equity $39,985 100%
Ratio Analysis 3.3 • Ratios also allow for better comparison through time or between companies • As we look at each ratio, ask yourself • How is the ratio computed? • What is it intended to measure (and why do I care about measuring this variable)? • What might a high or a low value tell us? How might such a value be misleading? • How could this measure be improved? • Ratios are used both internally and externally
Categories of Financial Ratios • Liquidity ratios (Measure short term solvency) • Financial leverage ratios (Long-term solvency) • Asset management ratios • Profitability ratios • Market value ratios
Liquidity Ratios • Current Ratio = Current Assets / Current Liabilities • 1,801,690 / 1,780,785 = 1.01 times • Quick Ratio = Current Assets – Inventory Current Liabilities • (1,801,690 – 388,947) / 1,780,785 = .793 times • Cash Ratio = Cash / Current Liabilities • 3,171 / 1,780,785 = .002 times
Computing Long-term Solvency Ratios • Total Debt Ratio = Total Assets – Total Equity Total Assets • (4,931,444 – 1,761,044) / 4,931,444 = .6429 times or 64.29% • The firm finances approximately 64% of its assets with debt. • Debt/Equity = Total Debt / Total Equity • (4,931,444 – 1,761,044) / 1, 761,044 = 1.800 times • Equity Multiplier = Total Assets / Total Equity = 1 + D/E • 1 + 1.800 = 2.800
Computing Coverage Ratios • Times Interest Earned = EBIT / Interest • 820,183 / 52,841 = 15.5 times • Cash Coverage = (EBIT + Depreciation) / Interest • (820,183 + 362,325) / 52,841 = 22.38 times
Computing Inventory Ratios • Inventory Turnover = Cost of Goods Sold / Inventory • 1,762,721 / 388,947 = 4.53 times • Days’ Sales in Inventory = 365 / Inventory Turnover • 365 / 4.53 = 81 days
Computing Receivables Ratios • Receivables Turnover = Sales / Accounts Receivable • 4,335,491 / 1,095,118 = 3.96 times • Days’ Sales in Receivables = 365 / Receivables Turnover • 365 / 3.96 = 92 days
Computing Total Asset Turnover • NWC Turnover = Sales / NWC • 4,335,491 / (1,801,690 - 1,780,785) = 207.390 times • Fixed Asset Turnover = Sales / Net Fixed Assets • 4,335,491 / 3,129,754 = 1.385 times • Total Asset Turnover = Sales / Total Assets • 4,335,491 / 4,931,444 = .88 times • Measure of asset use efficiency • Not unusual for TAT < 1, especially if a firm has a large amount of fixed assets
Computing Profitability Measures • Profit Margin = Net Income / Sales • 471,916 / 4,335,491 = .1088 times or 10.88% • Return on Assets (ROA) = Net Income / Total Assets • 471,916 / 4,931,444 = .0957 times or 9.57% • Return on Equity (ROE) = Net Income / Total Equity • 471,916 / 1,761,044 = .2680 times or 26.8%
Computing Market Value Measures • Market Price = $60.98 per share • Shares outstanding = 205,838,910 • PE Ratio = Price per share / Earnings per share • 60.98 / 2.41 = 25.3 times • Market-to-book ratio = market value per share / book value per share • 60.98 / (1,761,044,000 / 205,838,910) = 7.1 times
Deriving the Du Pont Identity 3.4 • Multiply by 1 and then rearrange NI = Net Income TE = Total Equity TA = Total Assets
Deriving the Du Pont Identity • Multiply by 1 again and then rearrange
Using the Du Pont Identity • ROE = PM * AY * EM • Profit margin is a measure of the firm’s operating efficiency – how well does it control costs • Asset Yield (Total asset turnover) is a measure of the firm’s asset use efficiency – how well does it manage its assets in driving sales • Equity multiplier is a measure of the firm’s financial leverage
Using Financial Statement Information 3.5 • Internal uses • Performance evaluation – compensation and comparison between divisions • Planning for the future – guide in estimating future cash flows • External uses • Creditors • Suppliers • Customers • Stockholders
Benchmarking • Ratios are not very helpful by themselves; they need to be compared to something • Time-Trend Analysis • Used to see how the firm’s performance is changing through time • Internal and external uses • Peer Group Analysis • Compare to similar companies or within industries • NAICS (North American Industry Classification System) codes, RMA, Financial Post Datagroup, and Dun & Bradstreet Canada
Potential Problems with Ratios • There is no underlying theory, so there is no way to know which ratios are most relevant • Benchmarking is difficult for diversified firms • Globalization and international competition makes comparison more difficult because of differences in accounting regulations • Varying accounting procedures, i.e. FIFO vs. LIFO • Different fiscal years • Extraordinary events
Quick Quiz • What is the Statement of Cash Flows and how do you determine sources and uses of cash? • How do you standardize balance sheets and income statements and why is standardization useful? • What are the major categories of ratios and how do you compute specific ratios within each category? • What are some of the problems associated with financial statement analysis?
Summary 3.6 • You should be able to: • Identify sources and uses of cash • Understand the Statement of Cash Flows • Understand how to make standardized financial statements and why they are useful • Calculate and evaluate common ratios • Understand the Du Pont identity • Describe how to establish benchmarks for comparison purposes and understand some key problems that can arise