Download
1 / 20
200 likes | 353 Vues
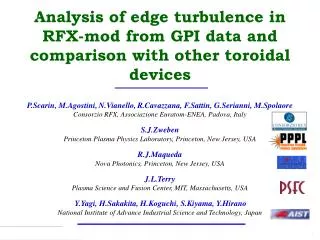
Analysis of edge turbulence in RFX-mod from GPI data and comparison with other toroidal devices. P.Scarin, M.Agostini, N.Vianello, R.Cavazzana, F.Sattin, G.Serianni, M.Spolaore Consorzio RFX, Associazione Euratom-ENEA, Padova, Italy S.J.Zweben

E N D
Analysis of edge turbulence in RFX-mod from GPI data andcomparison with other toroidal devices P.Scarin, M.Agostini,N.Vianello,R.Cavazzana, F.Sattin, G.Serianni, M.Spolaore Consorzio RFX, Associazione Euratom-ENEA, Padova, Italy S.J.Zweben Princeton Plasma Physics Laboratory, Princeton, New Jersey, USA R.J.Maqueda Nova Photonics, Princeton, New Jersey, USA J.L.Terry Plasma Science and Fusion Center, MIT, Massachusetts, USA Y.Yagi, H.Sakakita, H.Koguchi, S.Kiyama, Y.Hirano National Institute of Advance Industrial Science and Technology, Japan 13th RFP Workshop October 9-11 2008 Stockholm
Introduction • Turbulent structures are detected in the edge region of several plasma devices: Tokamak, Stellerator, RFP, non fusionist machines • Structures are considered the main cause of transport and confinement degradation • Statistical analysis of edge turbulence reveals the presence of common properties that do not depend on the particular plasma device: indication of a similar physical driving mechanism • Statistical properties of edge signals of four different fusion devices are analysed and the common properties are pointed out • The different turbulent time and space scales between the four experiments seems to be linked with the edge pressure gradient scale • Indication of pressure-driven instability Introduction 13th RFP Workshop October 9-11 2008 Stockholm
Edge Structures NSTX • In the edge region, potential, density and temperature signals are characterised by strong fluctuations Dt=0.4 ms Dt=1.2 ms Dt=0.8 ms Dt=0 Dt=12 ms Dt=0 • Strong bursts in the signals are related with the presence of coherent structures (blobs) propagating in the plane perpendicular to the main magnetic field Dt=24 ms Dt=36 ms RFX-mod f [mm] f [mm] f [mm] f [mm] r [mm] r [mm] r [mm] r [mm] G.Serianni et al., PPCF 49 2075 (2007) Introduction 13th RFP Workshop October 9-11 2008 Stockholm
Main Diagnostic: GPI The edge regions of RFX-mod TPE-RX NSTX Alcator C-mod are studied with the Gas Puff Imaging diagnostic GPI is a non intrusive spectroscopic diagnostic which measures the local emission fluctuations of Ha Da HeI lines in the plane perpendicular to the main magnetic field R.Cavazzana et al. RSI 75 4152 (2004) M.Agostini et al., RSI 77 10E513 (2006) P.Scarin et al., JNM 363-366 669 (2007) Zweben S. et al., NF 44 134 (2004) Terry J. et al., JNM 290 757 (2001) Introduction 13th RFP Workshop October 9-11 2008 Stockholm
PDF of the Signals NSTX Alcator C-mod PDF of raw signals are clearly non Gaussian in all the devices Deviation from Gaussianity increases outward RFX-mod TPE-RX Raw Signals 13th RFP Workshop October 9-11 2008 Stockholm
Statistics Vs Radius Alcator C-mod • Flatness and skewness increase outside the separatrix • Edge fluctuations are more and more dominated by positive (S>0) bursts with high amplitude (high F), relative to the mean value of the signals, as one moves outward NSTX 13th RFP Workshop October 9-11 2008 Stockholm Raw Signals
Universal Statistics Experimental PDF can be fitted with 2 Gamma functions:coefficient of the curve provide information about the physics of the system Parabolic relation between F & S for the edge fluctuations in all the devices analysed: few conditions expected to hold for different environments B.Labit at al. PRL 98 255002 (2007) Schopflocher T.P. et al. Boundary-Layer Meteorology 115 341 (2005) Sura P. and Sardeshmukh, J.Phys. Oceanogr. 38 638 (2008) F.Sattin et al. PPCF 48 1033 (2006) F.Sattin et al. submitted to PPCF Raw Signals 13th RFP Workshop October 9-11 2008 Stockholm
Power Spectra • Power spectra show (typically) different regions with power law-decay f * • f* should be linked to the turbulence injection scale Time Scales 13th RFP Workshop October 9-11 2008 Stockholm
Intermittency RFX-mod TPE-RX NSTX The PDFs of the edge fluctuations depend on the scale of the fluctuations Alcator C-mod • Different time scales involved t* • t*assumes values similar to f* -1 Time Scales 13th RFP Workshop October 9-11 2008 Stockholm
Flatness Comparison For a set of different discharges F(t) has been evaluated for the different devices Time scale t multiplied for f* • For all the machines flatness reaches the Gaussian values of 3 for tf*=1 • Coherent structures develop for tf *<1 Structures Injection No structures τf *=1 is linked with the largest spatial scale present in the system Time Scales 13th RFP Workshop October 9-11 2008 Stockholm
Edge Gradients The edge region of fusion devices are characterised by the presence of strong gradients that are possible sources of free energy for the development of turbulence • In tokamaks the edge region is fundamental in the rising and sustaining of the H-mode regimes [eV] RFX-mod NSTX Gradients 13th RFP Workshop October 9-11 2008 Stockholm
Turbulence Vs Edge Gradients NSTX Link between electron pressure gradient and edge structures TPE-RX Langmuir probes Area occupied by edge structures (fp) increases from inward to outward RFX-mod Alcator C-mod Different experiments characterised by different pressure gradient scales Lp Langmuir probes Gradients 13th RFP Workshop October 9-11 2008 Stockholm
Turbulence & Injection Scale • Largest spatial scale present in the system: Autocorrelation time NSTX RFX-mod v⊥τa Alcator Clear relation between the largest structures and the characteristic pressure gradient scale Lp Gradients 13th RFP Workshop October 9-11 2008 Stockholm
Conclusions • Universal statistical properties have been detected in the edge region of four plasma fusion devices • A common largest spatial scale present in the systems can be identified • This spatial scale linked with the energy injection scale of the turbulence is clearly linked with the pressure gradient scale • Pressure-gradient instabilities should play a role in the generation and evolution of the edge turbulence 13th RFP Workshop October 9-11 2008 Stockholm Conclusions
Statistical Properties of GPI signals in RFX-mod • Flatness (F) as a function of Skewness (S) for the GPI fluctuations (about 40000 points) • The data can be fitted with a quadratic polynomial, and the result are very similar to the one reported for TORPEX machine in [B. Labit et al., PRL 98 (2007) 255002] • In the graphs different plasma conditions are considered (about 2000 different plasma discharges) • The numerical values of the coefficients of the curve provide information about the specific physics of the system • The analytical curve is a general consequence of a few conditions expected to hold for different environments [Schopflocher T.P. et al. Boundary-Layer Meteorology 115 341 (2005), Sura P. and Sardeshmukh, J.Phys. Oceanogr. 38 638 (2008),……………] 13th RFP Workshop October 9-11 2008 Stockholm
Statistical properties of GPI signals in RFP&Tokamak F = a S2+b for a large range of F and S values An estimate of coefficient a would bring information of underlying physical mechanism 13th RFP Workshop October 9-11 2008 Stockholm
Pressure Driven Instabilities in TPE-RX and RFX-mod TPE-RX • In TPE-RX device phase relation between Vfand GPI structures (link to ne) is 90° • Indication of curvature driven instabilities [ M. Agostini et al., Plasma Phys. Control Fusion 50 (2008) to be published] RFX-mod • In RFX-mod phase relation between Vp and ne(measured at I < 350kA)varies from 90° to 0° • Different pressure driven instabilities 13th RFP Workshop October 9-11 2008 Stockholm
GPI and Langmuir diagnostics are active simultaneously in RFX-mod at I<350kA although at different locations • The (S, F) dataset of ne from Langmuir overlaps with the GPI database • The good overlap supports the assumption that GPI provides a measure with an equivalent statistic to plasma density fluctuations • Time correlation between GPI and ion saturation current signals in TPE-RX taken simultaneously at almost the same location • The high value of the correlation suggests that the 2 signals unveil the same dynamic of the turbulence GPI-Langmuir comparison TPE-RX 13th RFP Workshop October 9-11 2008 Stockholm
…..about the shape of Power Spectrum S(ƒ) (1) S(ƒ) tails can switch from exp to power-law on the same plasma pulse Power-law exp …it depends from the distribution of burst times ? 13th RFP Workshop October 9-11 2008 Stockholm
…..about the shape of Power Spectrum S(ƒ) (2) …with the time scale analysis ones obtain different distributions, with different width: • S(ƒ) power-law wide distribution • S(ƒ) exp narrow distribution τ [μs] The S(ƒ) of edge turbulence may be interpreted as arising from superposition of signals with different coherent structures and the time width distribution could depend from the displacement of magnetic surface (radial component) 13th RFP Workshop October 9-11 2008 Stockholm