Download
1 / 22
240 likes | 490 Vues
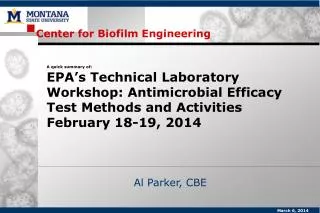
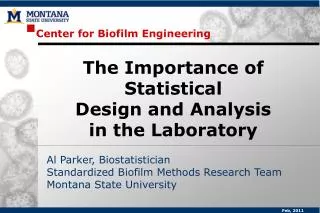
Center for Biofilm Engineering. Statistically assessing limits of detection and performance standards. Albert Parker Biostatistician and Research Engineer Montana State University. July 2010. Standardized Biofilm Methods Laboratory. Diane Walker Paul Sturman. Lindsey Lorenz

E N D
Center for Biofilm Engineering Statistically assessing limits of detection and performance standards Albert Parker Biostatistician and Research Engineer Montana State University July 2010
Standardized Biofilm Methods Laboratory Diane Walker Paul Sturman Lindsey Lorenz Kelli Buckingham-Meyer Marty Hamilton Darla Goeres
Statistical thinking • Limit of Detection • Dealing with counts below the detection limit • Performance Standards
Single tube test method 1. inoculate 2. expose & neutralize 3. enumerate Coupon w/ biofilm Rinse Sonicate, vortex Dilute, plate
10-fold Dilution series of concentrated cells Treated coupon 1 mL 1 mL 1 mL 1 mL 1 mL 1 mL 9ml buffer Dilution: 5 9ml buffer Dilution: 6 Concentrated Cells Dilution: 0 9ml buffer Dilution:1 9ml buffer Dilution: 2 9ml buffer Dilution: 3 9ml buffer Dilution: 4
Counting cfu’s EPA 2007 If 40mlis the original volume and 0.1ml is the volume plated, then using the counts of 126 and 181at the 4th dilution, it is estimated that there were • average(126,181) x 40/0.1 x 104= 6.14 x 10⁸ • biofilm bacteriaon the carrier.
Limit of Detection in Chemistry In chemistry, Currie (1968 and 1995) used the term detection limit to refer to a true concentration that has a small probability of generating measured values smaller than some critical value (such as 0). Excerpt from the Technical Support Document for the Assessment of Detection and Quantitation Approaches, Engineering and Analysis Division, Office of Science and Technology, EPA, 2003.
Limit of Detection in Chemistry X = measured concentration LOD = true concentrationp(X<=0 | LOD = 3.29) <= .05
Analogous Limit of Detection in Microbiology X = cfu’sat dilution d LOD = true number of bacteria in the original beakerp(X = 0 | Count = 3) <= .05 LOD = Count x 40/.1 x 10d LOD = 3 x40/.1 x10d Julia Sharp and Marty Hamilton, Detection Limits in Microbiology, MSU masters project,2001.
Conventional “Limit of Detection” in Microbiology X = cfu’sat dilution d “LOD” = true number of bacteria in the original beakerp(X = 0 | Count = 1) <= .37 “LOD” = Count x 40/.1 x 10d “LOD” = 1 x 40/.1 x 10d
Counts below the detection limit in Microbiology When all zero cfu’s are observed for all dilutions plated in this example … This happens 5% of the time when the number of bacteria in the original volume is LOD = 3 x 40/0.1 x 103 = 1.2 x 10⁶ This happens 37% of the time when the number of bacteria in the original volume is “LOD” = 1 x 40/0.1 x 103 = 4x 10⁵
Counts below the detection limit in Microbiology What to do? 2.0 x 10⁵ • Substitute a 1 • Substitute a 1/2 1.0x 10⁵
Values below the detection limit in Chemistry When values are observed below the LOD: • Substitute a small number such as LOD/2 or LOD • (analogous to what is done in microbiology) • Use a “robust method” which ignores these values • Random substitution • Bayesian methods
Values below the detection limit in Microbiology • There is no single solution for all scenarios! • The appropriate approach depends on: • The percentage of valuesbelow the LOD • The EPA recommends substitution rules if <15% of the • values are below the limit of detection. • - Guidance for Data Quality Assessment, Office of Research and Development, EPA, 1998. • - Singh and Nocerino, Robust Estimation of Mean and Variance Using Environmental Data Sets with Below Detection Limit Observations, EPA, 2001. • The goal of the study! • - Mean estimation? • - Variance estimation?
Values below the detection limit in Microbiology • Substitute a small number such as 1/2 or 1 • - Introduces bias into biofilm density estimates • - Biases variability • Use a “robust method” which ignores these values • - Biases variability • Random substitution • - Non-unique biofilmdensity estimate • Bayesian methods • - Area of research at the CBE
Performance Standards for a Quantitative Disinfectant Test • Performance standards are moving to quantitative tests. Understanding how the limit of detection affects quantitative measures is important. • Currently, performance standards for a disinfectant are “semi-quantitative” – e.g., the use dilution method. • Future performance standards may require that a mean quantitative efficacy measure, such as the log reduction, exceeds a target value with confidence. • To meet a target value with confidence, disinfectant mean efficacy and variability must both be estimated.
Example of a Performance Standard for the LR Controls Treated Log Reduction LR = 8.38 – 3.82 = 4.55 SELR = .9111 CI95% = (1.89, 7.21) The LR is not significantly larger than the target value = 2 mean 8.38 mean 3.82
Non-detect effect on Performance Standards for the LR Controls Treated Log Reduction LR = 8.38 – 4.28 = 4.10 SELR = .5865 CI95% = (2.38, 5.81) The LR is smaller SELR is smaller CI95% is more narrow The LR is significantly larger than the target value = 2 mean 8.38 mean 4.28
Performance Standards for a Quantitative Disinfectant Test • Confidence intervals to assess performance are affected by • substitution rules for values below the limit of detection. • Instead of confidence intervals, requirements could be placed • on the LR and on SELR. For example, if the • target value is 2 • then the requirements • LR > 3.5 • SELR < 0.5 • would alleviate effects of values below the limit of detection on the test outcome.
Summary • In other fields of science, the limit of detection is a statement based on a probability. For microbiology, this statement is: • LOD = 3 x (scale-up factor) x 10d • Substitution rules affect biofilm density and variability estimation. Appropriate action on values below the limit of detection depend on the goals of the study. • Performance standards unaffected by values below the limit of detection are desirable.