Download
1 / 51
510 likes | 1.03k Vues
Cover Story – FTP – What the industry wants?<br>With the new Foreign Trade Policy scheduled to be announced this month, we give you a 360 degree round-up of what the industry feels should be done to achieve those elusive ache din... Read More at https://www.thedollarbusiness.com/magazine/archives

E N D
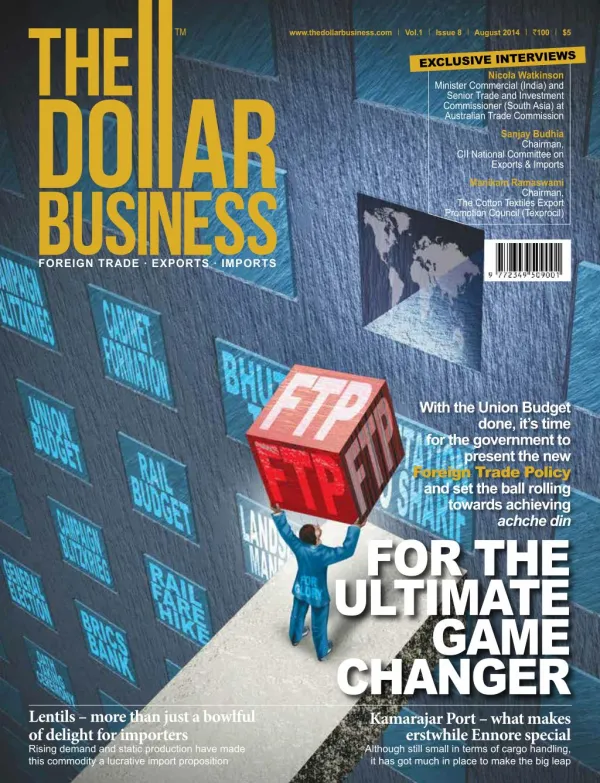
www.thedollarbusiness.com Vol.1 Issue 8 August 2014 100 $5 EXCLUSIVE INTERVIEWS Nicola Watkinson Minister Commercial (India) and Senior Trade and Investment Commissioner (South Asia) at Australian Trade Commission Sanjay Budhia Chairman, CII National Committee on Exports & Imports Manikam Ramaswami Chairman, The Cotton Textiles Export Promotion Council (Texprocil) FOREIGN TRADE . EXPORTS . IMPORTS With the Union Budget done, it’s time for the government to present the new Foreign Trade Policy and set the ball rolling towards achieving FOR THE ULTIMATE GAME CHANGER Kamarajar Port – what makes erstwhile Ennore special Although still small in terms of cargo handling, it has got much in place to make the big leap achche din Lentils – more than just a bowlful of delight for importers Rising demand and static production have made this commodity a lucrative import proposition
LETTER FROM THE EDITOR–IN–CHIEF THE LAST FTP WAS A ‘PASS’. IT SCORED 40%! B Policies cannot be judged unequivocally by outcomes. Under such ambiguity, let us say that in many-a-case, failure becomes the twin of a noble impulse, and criticism is the out- come of bold decisions at a macro-level. But there is an indicative measuring rod. A number that has a soul to appraise performance vis-a-vis promise. When FTP 2009-14 was released, the-then policymakers had set a target of crossing the $500 billion mark in India’s exports by FY2014. The target therefore called for $315 billion in incremental annual exports. By FY2012, it had become profoundly certain that India’s FTP lacked punch – perhaps some real big incentives in the form of credit scrips or drawbacks or even interest rate subven- tions. Our exports that year touched $306 billion, and the utopian expectation of achieving close to $200 billion more in two years seemed unreasonable. During that time, a voice from one of the government chambers claimed thus: “We are well on course to achieve the target to touch the $500 billion mark by 2014...” Minus the ego trip of making an argument to a favoured audience, the claim was hollow. What ensued from the FTP was that India’s total exports in each of the two years following this statement hardly budged. As compared to a target of $500 billion, our exports just about managed to vault past the $313 billion level. Conclusion: Instead of a $315 billion jump that was promised, India’s annual export saw an annual addition of only $128 billion – 40.75% of the desired increase. Going by what we’ve traditionally been taught in school, that meant a pass percentage. But that isn’t enough. What we expect from the new FTP is simple: some bold moves. There are many issues that can be addressed by the new FTP – the strange co-existence of Advance Authorisation and Duty Free Import Authorisation scheme (in the absence of transferability of duty credit scrips), non-accountability of individual States (a five year State-level export policy should be made mandatory), question over the continuation of interest rate subvention schemes (playfully extending such schemes year-on-year isn’t a healthy idea), ineligibility of Service Exports from FMS (Service exports of India brought in $153 billion in forex earnings in 2013; why should we put one sector at a disadvantage to give advantage to another – and what’ the methodology of choosing “select” names in this category?), high transaction costs for exporters (just implementing e-payment systems will not help)...and many more. Real incentives will mean spiritual joy for the exporter community. An exports target of $500 billion in five years (that we missed in 2009-14) could either be a proof of the difficulty of forecasting, or that there is much change that can be incorporated in the new FTP. Whatever that can be done should be done to ensure that the next time we compare the elephant and the dragon in global trade, we get more respect. Forget China, we are behind countries like Mexico and Belgium in exports! An ambitious target isn’t the issue. It’s the policy that has to trigger the onward march beyond borders. A bold, redrafted FTP that can achieve more than just passing percentage when reviewed five years later is what India needs. And that’s not an illogical ask. Or is it? y the time you lay your hands on this issue, expectations from the new Foreign Trade Policy (FTP) would have grown. You are bound to come across pundits conjecturing without evidence, or communities quietly wishing that their trade, swaddled with much suffering turns joyful under the moonlight of true courage on the policymaking front. For the export-import community in India, this is the real union budget, one that will choreograph India’s folk dance in an age of globalisation. This is one foreign policy document that India should care about. When FTP 2009-14 was re- leased, the-then policymak- ers had set a target of cross- ing the $500 billion mark in India’s exports by FY2014. In FY2014, our exports just about managed to vault past the $313 billion level! Steven Philip Warner Editor-in-Chief, The Dollar Business steven@thedollarbusiness.com @SPWarner www.thedollarbusiness/blogs/steven AUGUST 2014 II THE DOLLAR BUSINESS 1
Volume: 01 Issue: 08 August 2014 www.thedollarbusiness.com facebook.com/tdbIndia twitter.com/TheDollarBiz in.linkedin.com/in/thedollarbusiness/ EDITORIAL & RESEARCH Editor-in-Chief: Steven Philip Warner Editor: Manish K. Pandey Executive Editor: Shakti Shankar Patra Deputy Editor (Online): Bidhu Bhushan Palo Senior Editors: Jayashankar Menon, Satyapal Menon Assistant Editor: Sisir Kumar Pradhan Special Correspondent: Neha Dewan Principal Correspondent: Sachin Manawaria Senior Correspondent: Purba Das Editorial Coordinatior: Deepa Pandey EDITORIAL CONSULTING BOARD Founder & Editor: Anil Goyal Publisher: Avnish Goyal Chief Consulting Editor: Dr. A. K. Sengupta (Former Dean, IIFT) RENDEZVOUS SANJAY BUDHIA, CHAIRMAN, CII NATIONAL COMMITTEE ON EXPORT & IMPORT On what the near term holds for India’s exports 94 18 OVERSEAS TALK NICOLA WATKINSON, MINISTER COMMERCIAL (INDIA), AUSTRALIAN TRADE COMMISSION What really matters is the expansion of trade relations and not necessarily who has a surplus and who runs a deficit BRAND ACTIVATION & RESPONSE Vice-President (North and East): Aninda Mondal Manager (West and South): Manish Y. Naik ART & PHOTOGRAPHY Art Director: Sujesh Kumar G. Senior Designer: Sonia Kholgade Photographer : Dileep Kumar THE DOLLAR BUSINESS ONLINE Senior Web Developer: Bhanu Prakash Web Developer: K. Naveen, Web Designer: S. Vamshi Krishna Associate (Web & Network): C. Dileep Reddy DOCKYARD KAMARAJAR PORT LTD India’s only corporate major port is also a ‘landlord’ 70 CIRCULATION & DISTRIBUTION General Manager: S.S. Sudesh Asst. Manager: M. Vinay Kumar, Buddhisagar Pandey, Sanjeev Jain Senior Executive: G. Madhan Rao GLOBAL TRADE THIS MONTH From China becoming the biggest trader to Yemen joining the WTO 06 EXCLUSIVE INTERVIEW FINANCE & LOGISTICS Manager: Parchuri Jhansi Associate: Raj Jarikote 34 COVER STORY 48 PRINTER Kala Jyothi Process Pvt. Ltd., 1-1-60/5, RTC Cross Road, Musheerabad, Hyderabad, Telangana 500020, IN INDIA TRADE THIS MONTH Govt flip-flop on MEP, covert trade war with China and much more 10 ANISH GOEL, MANAGING DIRECTOR, VICTORINOX INDIA FTP - WHAT THE INDUSTRY WANTS? With the new Foreign Trade Policy scheduled to be announced this month, we give you a 360 degree round-up of what the industry feels should be done to achieve those elusive ache din BIG IDEA INDONESIA Shouldn’t we learn from our ancient mariners? 28 PUBLISHED AT 5-2-198/4, Distillery Road, Ranigunj, Secunderabad, Telangana 500003, IN Why you can’t just make up the all powerful ‘Swiss Made’ SPOTLIGHT RUSSIA Has Putin bitten more than he can chew or is the Russian economy reviving © Copyright 2014 No part of this magazine may be reproduced in whole or in part without an ex- pressed permission of the publisher. The information on this magazine is for infor- mation purpose only. The Editor-in-Chief & Editor are responsible for the selection of news and content under PRB Act. Vimbri Media Pvt. Ltd. assumes no liability or responsibility for any inaccurate, delayed or incomplete information, or for any actions taken in reliance thereon. The information contained about each individual, event or organisation has been provided by such individual, event organisers or or- ganisation without verification by us. All disputes are subject to exclusive jurisdiction of competent courts and forums in Hyderabad, Telangana. Printed and published by Avnish Goyal for Vimbri Media Pvt. Ltd. Published at 5-2- 198/4, Distillery Road, Ranigunj, Secunderabad - 500 003, Telangana. 16 SECRET INGREDIENT T-SHIRTS How a small town in South India is dressing up the world 36 FOCUS AND PROMOTION - Not only do we need to focus in right earnest, we need to be cautious about what we promote EXEMPTIONS AND REMISSIONS - Why we shouldn’t tinker with drawbacks every other day EPCG - What do you do when a scheme is very successful but is a monitoring nightmare? EXPORT PROMOTION ZONES - Time for another wave; but then how long can hand-holding continue? SERVICES - Suffering from the taxmen’s inability to understand even services can be exported DEEMED EXPORTS - If we deem them as exports, shouldn’t we also treat them as exports? 80 M. RAMASWAMI, CHAIRMAN, TEXPROCIL On Chinese INFOGRAPHIC LIVE ANIMALS Billions of dollars exchange hands every year, but it’s still ignored 22 IMPORT’ONOMICS LENTILS When satisfying the taste buds is profitable as well 42 policy Printed at: Kala Jyothi Process Pvt. Ltd., 1-1-60/5, RTC Cross Roads, Musheerabad, Hyderabad - 500 020, Telangana. changes and everything else cotton FOR EDITORIAL/CONTENT QUERIES Email: editorial@thedollarbusiness.com . Tel: +91-40-6677 0766 GLOBETROTTER BAJAJ AUTO Time to learn from the past and transform again 24 PRIME FOCUS FREIGHT TRANSPORTATION Clogged arteries & the road ahead NEW-GEN NEWSMAKER Rajen Shah, Managing Director, Arihant Industrial Corporation Ltd. 82 90 FOR ADVERTISEMENT QUERIES Email: ads@thedollarbusiness.com . Tel: +91-40-6677 0765 FOR SUBSCRIPTION QUERIES Email:subscription@thedollarbusiness.com . Tel: +91-40-6677 0765 2 THE DOLLAR BUSINESS II AUGUST 2014 AUGUST 2014 II THE DOLLAR BUSINESS 3
inbox editorial@thedollarbusiness.com WE VALUE YOUR FEEDBACK, WHETHER CRITICISM OR APPRECIATION. AND HERE ARE A FEW THAT HIT OUR MAILBOXES IN JULY 2014 www.thedollarbusiness.com Vol.1 Issue 7 July 2014 100 $5 Y are the lifeblood of any thriving economy and this should be an excellent focused magazine. Best of luck! RAJESH GARG Global CFO & Member of the Board, Cipla Limited, Mumbai our magazine seems like a great idea to fill a crucial gap for Indian business. Exports EXCLUSIVE INSIDE COLUMN: Arthur C. Wheaton Director, WNY Labour and Env. Programs, Cornell University INTERVIEWS: Dr. Alok Bharadwaj Executive Vice President, Canon India R. Ramesh Kumar Executive Director, Council for Leather Exports Yaduvendra Mathur Chairman & Managing Director, FOREIGN TRADE DECODED EXIM Bank Marie-Josée Charbonneau Counsellor & Head, High Commission of Canada in India DESTINATION BRAZIL Is this booming Latin American market a delight for Indian exporters? Pectin – bet you haven’t heard about it A great example of the direct correlation between information asymmetry and rate of return Is India’s darling port losing its sheen? Many claim that all is not well at Kandla, India’s No.1 major port. Can it silence its critics? For Indian brides & foreign buyers With 80% of the world’s total turmeric being produced in India, this spice can work wonders for exporters How SFIS ‘almost’ became famous The objective of the “Served From India Scheme” was to boost exports of services from India. But has it, really? A commodities and areas for exports! It is the best available reference point for exporters and import- ers in the country. A must read for every stakehold- er in the arena of global trade. Aptly described as ‘Foreign Trade Decoded’! AREEJ AFTAB Assistant Professor, Indian Institute of Foreign Trade (IIFT), New Delhi great initiative, abundance of information, in-depth analysis, holistic coverage of thrust R 2014). I think it is really interesting how cycle ex- porters make money only due to incentives that the government provides. Looking at the glass half empty, should we not expect the government to give greater incentives to encourage such brave industry players? ARVIND MATHUR Chartered Accountant, New Delhi efer to The Midas Touch “Pedal your way to health and fortune” (The Dollar Business, July I ASHISH NANDA Director, Indian Institute of Management, Ahmedabad look forward to reading The Dollar Business with interest. Wish you the very best in this enterprise. T Canada’s commitment to increase trade ties with India. We really appreciate the profes- sionalism that you all work with and the final coverage is indeed impressive. We are indeed grateful to you for your willingness for choos- ing to cover Canada. It’s really encouraging for us when we witness the receptiveness of Can- ada’s efforts in strengthening bilateral relation- ship with India by a platform like yours. We are honored to be recognized for this, and we look forward to work with you in future endeavours. HIGH COMMISSION OF CANADA New Delhi he report published in the inaugural is- sue has provided a positive exposure for I you and your team for shaping it well for new age entrepreneurs who have the passion to go global in terms of reach and diversity. DR. K. SRINIVASA RAO General Manager – Strategic Planning, Bank of Baroda, Mumbai had the opportunity to go through a couple of is- sues of The Dollar Business. Congratulations to 4 THE DOLLAR BUSINESS II AUGUST 2014
GLOBAL TRADE THIS MONTH News & Analyses REPUBLIC OF THE PHILIPPINES RICE IMPORTS In the name of protection After winning approval of other WTO nations to extend (quantitative) re- striction on rice imports, Philippines has agreed to increase the WTO min- imum access volume (MAV) from 350,000 tonne to 805,200 tonne per year and lower the import duty on rice under the MAV limits from 40% to 35%. Rice imports outside of the MAV will continue to have a 50% tariff. The Philippines will allocate 755,200 tonne of rice imports under country specific quotas (which is likely to include China, India, Pakistan, Thailand and Vietnam), while any WTO member can supply the remaining 50,000 tonne. According to the Philippines Department of Agriculture (DA), milled rice production in the country increased by around 1.6 million tonne during CY2010 and CY2013. Howev- er, rice consumption in the country is higher than production and the country is expected to import around 1.6-2 million tonne of rice this year. The Philippines government is keen to protect local farmers from imports as rice from India, Thailand and other Asian exporters is substantially cheaper than local rice. Changes in the MAV for rice is part of the negotiations Philippines is involved in to seek a five-year extension of the WTO Quantitative Re- striction (QR) that expired in June 2012. KINGDOM OF SAUDI ARABIA NON-OIL EXPORTS Putting eggs in different baskets YEMEN REPUBLIC JOINING WTO Integrating with the new world order Yemen has become the 160th country and the 35th Least Developed Country (LDC) to join the World Trade Organisation (WTO). The entry will help Yemen gain preferential (sometimes duty-free) access to markets in several rich coun- tries. Yemen will also get technical assistance and capacity building from WTO to boost its trade. Yemen’s WTO commitments include granting trading rights in a non-discriminatory and non-discretionary manner by December 31, 2014, and opening market for goods and services. For goods, Yemen has committed to limit its tariffs to an average of 21.1% for all products – 24.9% on average for agricultural products and 20.5% for oth- er products. The country will also open its markets to 11 core services sectors: business services, communication services, construction and related engineering services, distribution services, educational and environmental services, financial services, health services, tourism and travel, recreational, cultural and sporting services and transport services. Yemen’s entry is expected to boost its trade with UAE, China, Netherlands, Saudi Arabia, Switzerland, Kuwait, India, Japan, Brazil, Turkey and USA – some countries with which it already has bilateral agreements signed. Expectations are that India’s exports to Yemen that fell y-o-y by 11.4% to about $1.3 billion in FY2014, will also get a boost with curbs on many imports removed. Saudi Arabia’s non-oil exports have in- creased significantly from last year due to increasing focus on economic diver- sification. According to official sourc- es, the value of Saudi Arabia’s non-oil exports in Q1 CY2014 stood at about $14.62 billion, up 18.7% y-o-y. The coun- try’s Minister of Commerce and Industry Dr. Tawfiq Bin Fawzan Al-Rabiah claims continued growth of non-oil exports will help economic diversification over the coming years. Its non-oil exports include plastics and metal goods. Wheat being harvested Saudi Arabia’s exports Total exports of $356 billion in CY2013 CROP PRICES ON A DECLINE Not a secular trend According to UN’s Food and Agricul- ture Organisation (FAO) and OECD, the recent decline in prices of major crops in the international market is likely to continue for another two years, when prices are likely to stabilise at pre-2008 levels. The FAO Food Price index stood at 161 in 2007, but surged about 25% to 201 points the next year. It peaked at 230 in 2011, but has declined since to around 206 as of June 2014. The reason for this decline has been higher produc- tion, which have pushed stocks to all- time highs. OECD Secretary-General Angel Gurría feels crop prices were un- usually high earlier and that agriculture markets are returning to more settled conditions now. FAO also feels another reason for a de- cline in crop prices is the change in food patterns across the world, with people consuming more protein, sugar and fats due to urbanisation. However, cereals are expected to continue to be the major staple in the next decade, with most of the production taking place in Asia and Latin America. “Developing regions will account for more than 75% of the addi- tional agricultural output over the next decade,” FAO says. A rice mill process production line 3% Traditional architecture in Sanaa, Yemen. Inhabited for more than 2.500 years, the Old City of Sanaa is a UNESCO World Heritage City 1% Philippines’ rice imports Import restrictions have ensured a massive fall in rice imports in recent years 1% 4% 5% 2,000 1,500 86% 1,000 500 0 Mineral Fuels Plastic and articles of plastic Organic Chemicals Fertilisers Inorganic Chemicals Other CY04 CY05 CY06 CY07 CY08 CY09 CY10 CY11 CY12 CY13 Source: International Trade Centre; figures in $ million Source: International Trade Centre; Breakup for CY2013 Yemen’s global trade Yemen’s total trade has never crossed even $20 billion UNTIED STATES’ INDEPENDENCE DAY CHINESE FIREWORKS Chinese crackers light up US skies Chinese fireworks industry got another feather on its cap as it dominated the US Independence Day celebrations. Most of the fireworks (estimated at millions of dollars) that brightened American skies on July 4 this year are believed to have been imported from China. China already controls the fireworks import market in US with imports from the dragon nation stand- ing at $203.6 million in CY2013. This is about 95% of the total fireworks im- ports by US during the year. Industry insiders claim that Chinese fireworks imports are likely to increase due to the product’s improving quality. They also claim that ‘Made in China’ fireworks are almost 10 times less expensive as compared to those made in US. 12 10 8 6 4 2 0 CY2004 CY2005 CY2006 CY2007 CY2008 CY2009 CY2010 CY2011 CY2012 Imports Exports Source: International Trade Centre; $ billion AUGUST 2014 II THE DOLLAR BUSINESS 7 6 THE DOLLAR BUSINESS II AUGUST 2014
GLOBAL TRADE THIS MONTH News & Analysis News & Analysis In the fifth review of the trade policies and practices of China during 2012- 2014, WTO said that China has become the world’s largest trader (excluding in- tra-EU trade) but needs to rebalance its economy and boost consumption in the country to maintain the growth. According to WTO, China’s merchan- dise trade stood at $4.16 trillion in CY2013, which included $2.21 trillion of exports and $1.95 trillion of im- ports. Manufactured products (mostly office machines, telecommunication equipment and textiles) accounted for around 94% of total exports by China in CY2013, while machines, chemicals, fuels, mining products and agricultural products accounted for most of the na- tion’s imports. WTO members say China’s growth model hinges largely on investment (FDI) and directed credit availability. China should rebalance its economic growth through policies to promote consumption and push for further liberalisation of the domestic market. WTO members have also urged Chi- na to have a transparent global trading system. It’s worth noting that China became a WTO Member in December 2001, almost seven years after India joined the WTO in January 1995. PEOPLE’S REPUBLIC OF CHINA LARGEST TRADER A dragon, in need of a rebalancing act ISLAMIC REPUBLIC OF PAKISTAN THRUST ON EXPORTS Waking up to economic reality CAMEL IMPORTS BAN SAUDI ARABIA-SOMALIA An economy left to survive on piracy? The Pakistan government is planning an overhaul of its trading model and of the Trade Development Authority of Pakistan (TDAP) as it aims to more than double its exports from the current $23.1 billion to over $50 billion per year. Pakistan’s Commerce Minister has said he has constituted a committee that will oversee the major transition. He said there is an urgent need to transform TDAP to boost exports. The minister has also asked the committee members to prepare a model that emulates the success of export-based East Asian economies. This is the first time TDAP has been targeted since it was established in 2006 under a presidential ordinance during Pervez Musharraf’s rule. In- dustry insiders claim the move will please several trade bodies and associ- ations in Pakistan that have accused TDAP of creating hurdles in exports and of monopolising exports in the name of quality restrictions. When Somalia got a federal government in mid-2012 after a fragile transition, many saw hope that the Horn of Africa had the best chance, in two decades, to survive and achieve stability. However, the country’s future is at stake due to both rebels and from a proposed ban of camel imports from the country by Sau- di Arabia. Somalia’s GDP per capita and human development indices are among the lowest in the world. Livestock still conststitutes the bulk of the country’s economy. According to the World Bank, livestock supports about 60% of Soma- lia’s jobs, 40% of its GDP and account for 80% of its exports. Almost 70% of Somalia’s livestock ex- ports find a destination in Saudi Arabia. Although camels account for a small share of the 4.5-5 million animals that Somalia exports to Saudi Arabia ev- ery year, experts feel any ban on camel imports by Saudi Arabia could have a cascading effect and devastate Soma- lia’s economy like it happened in 2000. About 14 years ago, Saudi Arabia had banned livestock imports from Somalia over quarantine concerns regarding the spread of rinderpest and Rift Valley fe- ver. This time, Saudi Arabia health offi- cials suspect Somali camels could be car- rying the deadly MERS virus, which has reportedly killed nearly 300 people and infected many more. China is also by far the world’s largest exporter of apparels with exports worth over $12 billion in CY2013 BRICS NEW DEVELOPMENT BANK A new threat to the IMF and the World Bank? Leaders of the BRICS have launched a $100 billion New Development Bank (NDB), which will be based in Shanghai. The first President of NDB will be from India. NDB will have an initial authorised capital of $100 billion and the initial subscribed capi- tal will be $50 billion, which will be equally shared among the founding members. NDB will aim to address financial constraints that BRICS nations and other developing econo- mies face. In a joint declaration, the BRICS members said, “We continue to face signif- icant financing constraints to address infra- structure gaps and sustainable development needs. With this in mind, we are pleased to announce the signing of the agreement establishing the New Development Bank (NDB), with the purpose of mobilising re- sources for infrastructure and sustainable development projects in BRICS and other emerging and developing economies.” BRICS has also launched a Contingent Reserve Ar- rangement (CRA), with an initial size of $100 billion, to help member nations manage cur- rency fluctuations and economic volatility. BRICS represents around 19.8% of global GDP and 16.9% of global trade. Total exports by the five member countries have grown over 500% in the last decade. In the four years between 2008 and 2012, BRICS’ inter- national trade increased almost 42%, from $4.3 trillion to $6.1 trillion. THE WORLD TRADE ORGANISATION (WTO) TRADE PROMOTION One way ticket to fame and glory The World Trade Organisation (WTO) has launched a ‘trade stories’ sel- fie competition, which will allow an individual to share one’s trade story with the world. The competition is a part of the run-up to WTO’s Public Forum that will take place during October. The theme this year is “Why trade matters to everyone” and the aim is to bring out the human angle behind trade. Do you think you can do it? Why not send your entry to WTO at selfie4trade@wto.org. Remember, the last day for entries is the 1st of Sep- tember. If you are selected, your selfie will be displayed at the Public Fo- rum, posted on the WTO website and its social media channels and of course flashed on news channels and newspapers worldwide. Livestock is the main occupation of the local population in Hargeisa, Somalia’s second largest city Xi Jinping President, China 8 THE DOLLAR BUSINESS II AUGUST 2014 AUGUST 2014 II THE DOLLAR BUSINESS 9
INDIA TRADE THIS MONTH News & Analysis News & Analysis JUTE INDUSTRY REVIVAL ATTEMPTS For a greener world The Indian government is trying to revive the domestic jute in- dustry that has been on a decline due to dropping demand for jute products and lack of modernisation. Although India is by far the world’s largest producer and consumer of jute products, increasing popularity of plastic substitutes and lack of mod- ernisation has hurt its jute industry. In the last 10 years, five units of National Jute Manufacturers Corporation Ltd. (NJMC) have been declared sick and jute prices have plunged close to the minimum support prices (MSP). In order to revive the sagging fortunes of the industry, the government recently approved Rs.1,562.98 crore, which in- cludes financial restructuring and grant for Voluntary Retire- ment Schemes (VRS) of mills under NJMC. The government has also launched the Jute Technology Mission (JTM) under which a subsidy of Rs.104.36 crore has been provided to help jute mills install new machinery. Experts say demand for envi- ronmental friendly products is growing all over the world and the jute industry in India and Bangladesh (the world’s largest exporter of jute products) should grab this opportunity. CHINESE MILK EXTENSION OF BAN Need Operation Flood 2.0 The Directorate General of Foreign Trade (DGFT) has extended the ban on imports of milk and dairy products from China until June 22, 2015 over concerns of melamine contamination. The ban covers chocolates, chocolate products, candies, confectionery and food preparations made with milk or milk solids. It’s worth noting that milk production in India – the world’s largest producer – increased by about 7.6 million tonne to about 140 million tonne in FY2014. However, consumption is rising at a much faster pace and is expected to reach around 200 million tonne by 2024. In fact, India’s Minister for Agriculture recently said, “India may have to import milk in the future if production does not grow by 6 million tons per year for the next 10 years.” Jute fiber being dehydrated after retting, alongside a road in Howrah Indo-Bangladesh trade Bangladesh’s exports to India is yet to cross $1 billion in a year INDIA-BANGLADESH TRADE TRADE DYNAMICS Too skewed for comfort The Confederation of Indian Industry (CII) claims India-Ban- gladesh trade could double to over $10 billion by FY2018 if Non-Tariff Barriers (NTBs) and infrastructure related con- cerns are addressed on both sides. At present, trade between the two countries is heavily tilt- ed in favour of India. According to CII, two-way trade be- tween India and Bangladesh stood at FY2014 with India’s exports at $6.1 and imports at a mere $462 mil- Decline in exports to India poses rious challenge for the Bangladeshi government and might trigger pro- tectionist measures in future. While revving up imports from Bangladesh may be difficult, CII suggests the skewed trade dynam- ics between the two nations could be redressed with greater investment participation of Indian companies in Bangladesh. Indian investments in Bangladesh stood at $2.5 billion in FY2013, and have surged in the last three years. “This can grow further,” says CII. CII suggests addressing NTBs such as harmonisation and non-recognition of technical standards can help. In addition, resolving CHINESE GELATINE DEMAND FOR BAN A matter of life and death India’s pharmaceutical industry has urged the Drugs Controller General of India (DCGI) to ban gelatine imports from China due to excessive presence of chro- mium. Gelatine is used by pharmaceutical companies to make the outer covering of some capsules. However, Indian pharmaceutical companies claim that in China gelatine is made out of the waste from leather factories and contain harmful levels of chromium. According to the US Food and Drug Administration (USFDA), numerous companies in China use industri- al-grade gelatine to make pharmaceutical-grade gela- tine capsules. “This industrial-grade gelatine contains more chromium than the edible gelatine that firms should have used,” it says. Indian pharma companies claim that although the Chinese Food and Drug Ad- ministration (CFDA) shut down certain factories man- ufacturing pharmaceutical-grade gelatine in China in 2012, the Indian government is yet to ban imports of chromium-tainted gelatine, which is cheap but harmful. It’s worth noting that in a recent report, the Asso- ciated Chambers of Commerce and Industry of India (ASSOCHAM) observed that while India is a leader in pharmaceutical exports with exports to over 200 coun- tries, it is heavily dependent on imports from China for many essential and large volume drugs. 7 6 5 4 3 2 $6.6 billion in billion 1 0 lion. a se- FY05 FY06 FY07 FY08 FY09 FY10 FY11 FY12 FY13 FY14 Exports from India Exports from Bangladesh Source: Ministry of Commerce, GoI; figures in $ billion infrastructure problems, and improving the investment process in Bangladesh with sin- gle window clearances, upgrading the tax holi- day system and improving connectivity can help bolster economic partnership between the two nations. As per CII, some potential sectors for investment in Bangladesh include electrical machinery and equipment, vegetable/roots and tubers, agro-processing, automobiles, textile (including home textile), organic chemicals and light engineering. In the ser- vices sector, ICT, pharmaceuticals, hospital & medical equipment, tourism and profes- sional services offer good opportunities. India’s imports of empty gelatine capsules Empty gelatine capsule imports saw a big surge in FY2010 20 18 16 14 12 10 8 6 4 2 0 FY05 FY06 FY07 FY08 FY09 FY10 FY11 FY12 FY13 FY14 Source: Ministry of Commerce, GoI; figures in $ million 10 THE DOLLAR BUSINESS II AUGUST 2014 AUGUST 2014 II THE DOLLAR BUSINESS 11
INDIA TRADE THIS MONTH News & Analysis News & Analysis HEALTH SUPPLEMENTS COURT VERDICT For freer markets Hearing the petition of Vital Neutraceutical, a Mumbai-based food business operator (FBO) and Indian Drug Manufacturers Association (IDMA), the Bombay High Court has quashed an advisory issued by the Food Safety and Standards Association of India (FSSAI), which had made prior product approval mandatory for dietary food and health supplements already licensed and existing in the market. The Court called the Product Approval (PA) adviso- ries issued by the FSSAI unlawful. According to the Advisory, manufacturers were required to take approval for a spectrum of food products including “novel foods, functional foods, food supplements, irradiated foods and genetically modified foods.” Clause 22 of the FSS Act/Rules & Regulations states that food business operators (FBOs), who are the manufac- turers of proprietary foods, genetically modified articles of food, functional foods, health supplements or nutraceuticals are required to apply for the product approval with the central licensing authority. ESSENTIAL ITEMS LIST ONION & POTATO No clear vision The Cabinet Committee on Economic Affairs (CCEA) has put onion and potato under the purview of stock holding limits under the Essential Commodities Act, 1955 to control pric- es and check hoarding. Prices of onion and potato increased sharply in May-June, with a 40% increase in wholesale prices of potato just in May. The government has already set a min- imum export price (MEP) of $450 per ton (about Rs.27 per kilogram) on potato which is expected to reduce exports. The government has also increased the MEP on onion to $500 per ton (about Rs.30 per kilogram) after the MEP of $300 per ton (about Rs.18 per kilogram) set in June failed to have any im- pact on onion exports and domestic prices. BHUBANESWAR WTC BRANCH It’s time to reach out to the world The World Trade Centre (WTC) has opened its new branch in Bhubaneswar, Odisha, making the state a part of the WTC network of 343 branches in 100 countries. The facility is the fifth WTC branch in India. Odisha’s Chief Minister Naveen Patnaik has promised that the branch will move into its own building within three years. The new WTC is expected to help boost trade in the state and act a as a bridge between local com- panies and global businesses. WTC Bhubaneswar will have top-end facilities to spur trade, including a convention centre and a 1.7-km skywalk to connect it with hotels. Odisha aims to increase exports from the state to Rs.29,693 crore in 10 years, for which exports must grow at a CAGR of 10% from its FY2013 level of Rs.11,448 crore. The state government has iden- tified minerals & metallurgical products, engineer- ing, chemical and allied products, marine products, electronics & software, agricultural products, hand- loom, textiles & handicrafts and tourism as sectors with vast potential for exports. To boost exports, Odisha plans to set a B2B exchange facility, a district level export promotion committee, and incentives like exporter’s green card for seamless passage of ex- port consignments. Naveen Patnaik Chief Minister, Odisha Indian onion and potato exports Last year India exported over $500 million worth of onions NORTH-EASTERN STATES FLORICULTURE EXPORTS Lure of the yen The Agricultural and Processed Food Products Export Development Au- thority (APEDA) is fast-tracking the development of a road map that will enable flower exports from North-Eastern states to countries with high demand like Japan. India’s floriculture exports grew strongly to about Rs.455.9 crore in FY2014, which is about 25% higher than that of FY2013. The floriculture sector in India is very fragmented, with most of the com- mercial cultivation in West Bengal (32%), Karnataka (12%) Maharashtra (10%) and almost half of the export units based in Karnataka, Andhra Pradesh and Tamil Nadu. In recent years, flower production in several states have declined due to warm weather conditions. However, experts feel the temperate cool weather in the North East is more suitable for flo- riculture and encouraging exports can act as a game changer for the do- mestic economy of the region. 600 500 400 300 200 100 0 FY05 FY06 FY07 FY08 FY09 FY10 FY11 FY12 FY13 FY14 Onion Potato Source: Ministry of Commerce, GoI; figures in $ million Industry insiders feel flower exports to Japan can be a game changer for North Eastern states RESERVE BANK OF INDIA INCREASE IN CREDIT PERIOD Diamonds shine back The Reserve Bank of India (RBI) has extended the credit period given by a foreign supplier to Indian buyers of rough, cut and polished diamonds to 180 days. Until now, the same was 90 days. According to the RBI, “Credit given by a foreign supplier to its Indian customer/ buyer, without any Letter of Credit (Suppliers’ Credit)/Letter of Undertaking (Buyers’ Credit)/Fixed Deposits from any Indian financial in- stitution for import of rough, cut and polished dia- monds, may be permitted for a period not exceeding 180 days from the date of shipment.” The RBI took the decision after considering proposals received from diamond importers and GJEPC. GJPEC has welcomed the move saying, “Supplier’s credit limit of 90 days was ‘severely ham- pering’ the business cycle and had become an im- pediment for export of cut and polished diamonds.” ORGANIC SUGAR EXPORTS CEILING REMOVED Sugar-coat the bitter pill The Directorate General of Foreign Trade (DGFT) has removed the ceiling of 10,000 tonne when it comes to the export of organic sugar, provided the export is registered with DGFT and certified by Agricul- tural and Processed Food Products Export Development Authority (APEDA). The move is aimed to help improve exports of sugar and allow more funds into an industry that hasn’t paid for a long time now. In FY2014, India’s sugar production stood at around 242.27 lakh tonne – down 4% y-o-y – of which 240 lakh tonne is expected to be consumed domestically. The surplus stock is estimated at 2.27 lakh tonne, which will push overall stocks to around 67.4 lakh tonne. However, industry insiders feel the removal of the quantitative ceil- ing on sugar exports is cosmetic because of the ‘organic’ rider as very few sugar mills in India have the certification. The certification pro- cess for organic sugar is also very lengthy. The sugar sector in India has been a political hot potato and sees policy changes very often Sacks of potato waiting to be loaded to a ship before being exported 12 THE DOLLAR BUSINESS II AUGUST 2014 AUGUST 2014 II THE DOLLAR BUSINESS 13
OVERSEAS TALK NICOLA WATKINSON, AUSTRALIAN TRADE COMMISSION, INDIA “WE BELIEVE INDUSTRIES GROW BETTER WHEN THEY ARE LESS PROTECTED” Indo-Australian trade ties haven’t really benefitted from the cricketing connect, with Australia not featuring even in the list of top 20 trading partners of India. To understand what is affecting the bilateral trade and what actually can be done to improve the situation, The Dollar Business sat down with Nicola Watkinson, Minister Commercial (India) and Senior Trade & Investment Commissioner (South Asia) at the Australian Trade Commission in New Delhi. Excerpts from the conversation: Indian exports to Australia Very little and fragmented 13% 11% 57% 8% BY NEHA DEWAN 6% 5% Gems and Jewellery Automobile and Accessories Pharmaceutical Products Mineral Fuels Textiles Other Nicola Watkinson Minister Commercial (India) and Senior Trade and Investment Commissioner (South Asia) at the Australian Trade Commission at New Delhi, India TDB: Bilateral trade between India and Australia is about $12.45 billion, with India having a trade deficit of close to $8 billion. Do you think India needs to be concerned about this trend? Nicola Watkinson (NW): A large chunk of our exports to India are energy relat- ed products. Given the strong focus that India has on energy security, this should not be a cause of concern and I am sure the Indian government has recognised Australia as a stable, long-term and re- liable partner. Also, a large number of Indian companies are integrating their operations in Australia. So, a lot of ener- gy related products that are coming from Australia, are actually coming from In- dian companies. We have enormous in- vestments from companies such as GVK and the Adani Group in our coal sector. I see this as a very positive development in our relationship. Another area which can be developed over time is Liquefied Natural Gas (LNG) as India looks at al- ternative fuels. Gas is probably one of the areas where we will be able to extend our relationship further. Australian exports to India Much about coal and copper! 23% 46% 3% 4% TDB: India’s bilateral trade deficit that we are referring to – is it here to stay? NW: I think the main focus should be on the overall growth of trade between the two economies. I see strong oppor- tunities for Indian companies who are looking to tap the Australian market. We have already seen very strong growth in 10% 14% Coking Coal Copper Ores Unwrought Gold Calcined Alumina Other Coal Other Source: Ministry of Commerce, GoI; Breakup for FY14 18 THE DOLLAR BUSINESS II AUGUST 2014 AUGUST 2014 II THE DOLLAR BUSINESS 19
OVERSEAS TALK NICOLA WATKINSON, AUSTRALIAN TRADE COMMISSION, INDIA TDB: How protected do Australian manufacturers feel then? Isn’t it dis- couraging for them to an extent be- cause you do not protect them while most countries – including US, espe- cially post-2008 – shield their manu- facturing corporations? NW: Of course, people have always asked for protection. But we have seen that companies in Australia have been able to work in an environment with lit- tle protection for them and at the same time, are globally competitive. They are born global. So, if they can compete against Indian or Chinese or Korean suppliers at home, they will be able to compete with them in their countries as well. We believe that if we actually want to have genuine global trade, we have to be prepared to play the game ourselves. Our textile industry is a great example of this. We do not have companies that produce low-quality products because we can get that more economically from India or Bangladesh. Therefore, the tex- tile industry in Australia is focused just on producing high-end sportswear, lei- surewear and bridal-wear. Australia offers world-class service solu- tions in age care. So, we would be very interested in offering our services in In- dia. It is a trend that I think is set to grow. the IT sector. Australia has been one of the top three global markets for Indian IT companies and they have been one of the largest sources of employment in Australia. They are certainly picking up large contracts in Australia, bringing the work back here. I believe this is an important export, which we shouldn’t ignore. Wellness products, particularly Ayurvedic products, are also seeing ris- ing demand from Australian consumers. THERE ARE PROGRAMMES THAT AUSTRALIA USES TO SUPPORT ITS NEW EXPORTERS. BUT THOSE ARE NOT SUBSIDIES TDB: Does the Australian govern- ment give any incentive to its services and manufacturing sectors that India needs to emulate? Does it provide extra incentives to its exporters? NW: There are a couple of programmes that Australia uses to support its new exporters. But those are not subsidies. They are supports to help them explore new markets or help produce market- ing material that will be specific for one particular market such as, say, China or Mexico. We just did a survey with 4,000 Australian exporters and asked them what makes it difficult for them to come to India. The answer is not subsidies; it is information and access to advice. TDB: India’s auto and auto component manufacturers have not been able to make inroads into Australia. What do you think is the reason? NW: The Australian automobile indus- try is going through a transition. A num- ber of auto manufacturers will be scaling down their manufacturing operations in Australia in the coming years. While they all have come a long way, they still have challenges in the level of innovation that they have in their companies. I think the growth of the global automotive sec- tor will not be in countries such as Aus- tralia – which has just 23 million people – but in high-growth and more populat- ed markets like India, China, Indonesia and Malaysia. readily understand. It will tell you the region, the vineyard and the year. In Australia, we realised that we need to tell people what kind of grape it is made out of. Telling them so will help them understand its flavour. We also tell the buyers what to do with it. We tell them what goes best with a particular wine. I think this is what really works in the In- dian market, which is still an emerging market for wine. The little information make our wine brands more approach- able. Another factor is new vinification (winemaking) techniques. We have tak- en our young wine makers to France for them to better understand vinification techniques. Our Minister for Tourism plans to bring a delegation of Australian wine makers to India to work with In- dian wine producers who are interested in partnering with us. We will be shar- ing some of our winemaking knowledge with our Indian counterparts that will help them improve quality, range and productivity. TDB: Australia is a huge consumer market. So, besides services, which are the other sectors or industries that In- dian exporters should focus on? NW: Australia is one of the most open economies in the world. It is ranked 11th in the world for ease of doing business. If you have a product in India that you are looking to export to a developed economy, which provides easy access and offers higher margins, then Austra- lia should certainly be on top of your mind. Also, in one of my recent interac- tions with the Federation of Indian Ex- port Organisations (FIEO), I learnt that they were looking to send a delegation to a large trade show in Australia, which is scheduled to happen in November this year. Moreover, import duties are very attractive for international companies looking at the Australian market. Hence, there is no reason why Indian exporters shouldn’t go to Australia. We have a phi- losophy that industries grow better when they are less protected. Our companies are more globalised because they are not shielded by subsidies or tariff barriers. Coal being loaded into a ship at Newcastle in Australia. Newcastle is the south hemisphere’s largest port for coal exports TDB: Australia’s Jacob Creek is one of the most widely imported wines in India. It’s more popular than even top French and Italian brands. Can you tell us the secret of the success of Austra- lian wine in India? NW: I think Australia has taken a very different approach towards marketing wine. If you look at French wine labels, it will not give you information that you tralia has signed a Free Trade Agreement with Korea, Japan and we are working very hard for a deal with China. We are definitely looking at creating stronger multilateral trade deals. With both coun- tries having new governments, I believe, now is a good time to look at how we can re-establish the CECA negotiations. panies are looking at opportunities to do business globally and entering markets that have an open working environment. TDB: Indian duty on wine imports is one of the highest in the world. What’s your view on this? NW: From an Australian perspective, we face the same wine tariff as some- one from US or France. So, this is not a competitiveness issue. The ones who are most affected by the high tariffs are the Indian consumers, who end up paying a lot for a bottle of wine. TDB: Education has been Australia’s dominant export to India. Do you see any other sector having the potential to scale up to those levels? NW: At the moment, the traditional business in education has been to attract Indians to study in Australia. We have reaped really good economic dividends from this business model. But now our focus is more on diversification and to increase the range of courses that they undertake. The other opportunity that I see is skill development and vocational training, which is altogether a different model. Apart from skill development and vocational training, there’s much opportunity in areas such as age care. It is still in a nascent stage in India while Indo-Australian merchandise trade India has almost always run a trade deficit with Australia TDB: What would be your message to Indian exporters who are looking at Australia as a potential market? NW: My message would be simple. Aus- tralia is open to doing business. It has one of the most stable and open economies in the world. It has good, solid growth. There are already a number of support mechanisms for exporters in Australia. There is a large Indian community that they can tap into. Just do some prepara- tion about what works in the market. TDB: In most countries, including In- dia, we see only big trading houses ben- efitting from these trade agreements. Don’t you think it is discouraging for small entrepreneurs as they are not really given a fair chance to compete against the big players? NW: What we are trying to do is bring together benefits for both large and small companies. The Australian economy comprises of largely small and medium enterprises. We do not really have any big MNC as such. Small and mid-size com- 18,000 16,000 14,000 12,000 10,000 TDB: The proposed Comprehensive Economic Cooperation Agreement (CECA) between India and Australia is yet to be signed. Can you tell us when the agreement will come into effect? NW: Australia is a very strong believer in multilateral and bilateral trade agree- ments. The current government in Aus- 8,000 6,000 4,000 2,000 0 FY05 FY06 FY07 FY08 FY09 FY10 FY11 FY12 FY13 FY14 India’s exports to Australia India’s imports from Australia neha@thedollarbusiness.com Source: Ministry of Commerce, GoI; figures in $ million 20 THE DOLLAR BUSINESS II AUGUST 2014 AUGUST 2014 II THE DOLLAR BUSINESS 21
Global live animals trade Breakup of India’s live animals exports 25 20 15 GOATS ..........................................................................84.0% POULTRY ......................................................................4.0% WEIGHING > 185 GM POULTRY ......................................................................5.0% WEIGHING <= 185 GM OTHER BIRDS............................................................2.0% PARROTS ......................................................................1.0% OTHER ............................................................................4.0% 10 5 Source: Ministry of Commerce, GoI; Breakup for FY2013 0 `FY04 FY05 FY06 FY07 FY08 FY09 FY10 FY11 FY12 FY13 Exports Imports Source: International Trade Centre; figures in $ billion India’s live animals exports is dominated by the export of goats, with most of them being exported to its neighbour Nepal For the last three years, live animals worth over $20 billion have been traded globally. (Note: Minor differences between exports and imports arise due to certain non-reporting countries) Breakup of India’s live animals imports India’s live animals trade PURE BRED BREEDING HORSES ................6.8% OTHER HORSES ....................................................30.3% POULTRY WEIGHING .........................................21.9% <= 185 GM OTHER MAMMALS ..................................................1.5% HORSES FOR POLO ...............................................0.7% OTHER ..........................................................................38.8% 18 16 14 12 10 Source: Ministry of Commerce, GoI; Breakup for FY2013 8 6 4 2 0 FY05 FY06 FY07 FY08 FY09 FY10 FY11 FY12 FY13 FY14 Exports from India Imports to India Horses are India’s main live animals imports, with close to $4 million worth of horses imported in FY2014. Most of them are imported from UK and US Source: Ministry of Commerce, GoI; figures in $ million India is a very small player in the global live animals trade, with just over $11 million worth of exports and $10 million worth of imports during the last fiscal Bovine animals account for over a third of global live animals trade, which also witnesses millions of dollars worth of trade in camels, horses, rabbits, reptiles and birds. Interestingly, even live bees worth over $35 million were traded in CY2013 11% HORSES, ASSES, MULES, HINNIES 9% OTHERS 5% SHEEP & GOATS Source: International Trade Centre; Breakup for CY2013 AUGUST 2014 II THE DOLLAR BUSINESS 23
GLOBETROTER BAJAJ AUTO STILL INDIA’S ‘CAR ON TWO WHEELS’? Geographical spread of exports Within Africa, Nigeria is the top destination Category-wise break up of exports Boxer is manufactured solely for exports KTM Discover Performance (Pulsar) Platina Boxer & CT100 Africa South Asia & Middle East ASEAN Latin America Rarely has a company chronicled the history of a country the way Bajaj Auto has done in the case of India. Right from the days of founder Jamnalal Bajaj – such an ardent follower of Mahatma Gandhi that the latter had adopted him as his son – the company has been a proxy to everything that is India. But having realised that the company had lived for far too long just on nostalgia, current Managing Director Rajiv Bajaj is a man on a mission to transform the very way the world looks at Bajaj Auto. Is he on the right track? The Dollar Business investigates 14% 19% 7% 46% 18% 2% 63% 28% 3% Source: Bajaj Auto; FY2014 Annual Report BY JAYASHANKAR MENON BY JAYASHANKAR MENON E ding, to a carrier of an entire family of four...Bajaj scooters used to be socialist India’s aspiration. It was India’s car on two-wheels! In fact, when in 2008, Ratan Tata spoke about the need for an ultra-low cost car for the “three-four family mem- bers on a scooter with a kid standing in the front, the guy driving and his wife sitting side saddle holding a little kid,” he was essentially, referring to his school buddy Rahul Bajaj’s company and how millions of his compatriots had virtually grown up on one of the gazillion scoot- ers manufactured by it. However, after reading these lines, if the same millenni- al rushes out to see what this so-called Bajaj scooter looked like, he/she would struggle. It doesn’t matter if the person lived in South Mumbai or rural Bihar. The transition – from start to comple- tion – from scooters to motorcycles hap- pened in a matter of just nine years. Bajaj Auto stopped manufacturing scooters in 2005. Today, its ‘brand new’ scooters have vanished from Indian streets. You might of course find one in an automo- bile museum. Just what happened in these few years? What actually caused India’s aspiration to change suddenly? xplaining what a Bajaj scooter meant to middle-class India to someone born after the mid- 1980s can be a daunting task. From being the default dowry at a wed- The transformation of Bajaj Auto from a geared scooter company to a motorcycle seller, with a focus on exports, is remarkable LUCRATIVE EXPORT INCENTIVES ENSURE THAT BAJAJ AUTO HAS THE HIGHEST OPM AMONG TWO WHEELER MAKERS IN INDIA FALLING IN LINE However, strange it might sound, it in- deed was a fact that in the 60s and the 70s, one had to wait for a decade to get one’s hand on a Bajaj scooter. The rea- son: India’s dreaded License Permit Raj. However, starting the late 80s, the wind changed direction around the world. The iron curtain lifted. The Berlin wall crum- bled. India too, although very hesitating- ly, opened up to market forces. Free market is not just about market, it is about the free human spirit. It’s about a kid learning to say no to his father – no, I won’t stand in front of your scooter. And despite having fought tooth and nail, the then Manmohan Singh-led govern- ment’s plan to open up the economy in 1991, the visionary in Rahul Bajaj, who served as the MD of Bajaj Auto for 35 years before giving it up in 2005, could read the writing on the wall. He could sense that Bajaj Auto’s bread and butter – the geared scooter – will have no place in 24 THE DOLLAR BUSINESS II AUGUST 2014 AUGUST 2014 II THE DOLLAR BUSINESS 25
GLOBETROTER BAJAJ AUTO torcycles. In the FY2001 letter, he said, “The Company’s motorcycle manufac- turing capacity has expanded to 50,000 per month.” A few months later in No- vember 2001, Bajaj Auto launched what was going to be a game changer – the Pulsar. By the end of FY2002, the un- thinkable had happened – Bajaj Auto had sold more motorcycles in the year than geared scooters! And the beat was actually a landslide. Motorcycle sales in FY2002 had beaten scooter sales by 60%. After this, it was just a matter of time. In FY2004, the company got a new sportier, younger-looking logo. In FY2005, Bajaj Auto sold close to 15x more motorcycles than scooters and by the end of the year, the last scooters were rolling out. Segment-wise total sales of Bajaj Auto Bajaj Auto stopped scooter manufacturing on December 31, 2005 FY2001 FY2002 FY2003 Motorcycles Geared Scooters Rest FY2004 FY2005 0% 10% 20% 30% 40% 50% 60% 70% 80% 90% 100% Source: Bajaj Auto Annual Reports ple – focus on exports. And the results were there for everyone to see. In the decade between FY2005 and FY2014, Bajaj Auto’s exports as a percentage of sales, surged from about 10% to over 40%. This meant that while its net sales in the same period went up over three- fold, they were overshadowed by ex- ports that surged by over 11x. This also meant higher margins what with the government providing tons of export in- centives. For example, in FY2014, Bajaj Auto reported Rs.335.94 crore as export incentives. Currently, Bajaj Auto exports to al- most 60 countries. It claims to be the No. 1 or No. 2 in 17 of them and is by far, In- dia’s top exporter of motorcycles. In fact, in FY2014, Bajaj Auto exported over 1.3 million motorcycles – more than 2/3rd of India’s total motorcycle exports. In terms of geographies, Africa in general and Nigeria in particular, seems to have taken a special liking for Bajaj motorcycles. According to Ashwin Pa- til of LKP Securities, “Nigeria accounts for almost 50% of Bajaj Auto’s motorcy- cle exports to Africa, and thanks to the popularity of the Boxer, the company’s pricing power in the Nigerian market is also very high.” Patil’s estimates suggest that Bajaj Auto’s margins in Nigeria are at least 6-7 percentage points higher than its overall margins. Does this mean all’s hunky dory with Bajaj Auto? Not actually. a 3.9% growth – third straight year with over 10 million in sales. It also meant that Bajaj Auto now has just a 20% share in the domestic motorcycle market and has recently been relegated to No. 4 in the overall two-wheeler market as an old quandary comes back to haunt it. “Every 4th two-wheeler sold is a scoot- er,” read the headline of a leading news- paper a few weeks before this issue went to print. The transition of India from an ‘Only-scooter’ two-wheeler market until the early 90s to ‘What’s a scooter’ two-wheeler market in the first decade of the new century, has now turned full circle. While domestic motorcycle sales rose 3.9% in FY14, scooter sales surged by 23% as Indians lapped up new-age scooters from Honda, Piaggio, TVS, Hero Moto and even Suzuki and Mahin- dra. What must be worrisome for Bajaj Auto is the fact that this is not an aber- ration but a trend as scooter sales as a percentage of total two-wheeler sales has consistently risen from 14 in FY2008 to 25 in FY2014, while that for motorcy- cles have dipped from 79 to 70 during the same period. This has not gone un- noticed by Dalal Street as shares of Bajaj Auto have been forced to trade at a dis- count to those of rival Hero MotoCorp, which continues to focus on India. IN FY2014, BAJAJ AUTO’S EXPORT INCENTIVES FELL TO RS.335.94 CRORE VS RS.416.75 CRORE Y-O-Y DUE TO LOWER DUTY DRAWBACKS Bajaj scooters have been life long companions for even many affluent Indians like Ameet Singh, a Voice Over professional based in GREENER PASTURES If one thought with the passing of the baton to Rajiv Bajaj from the ‘scooterwa- la’ father and manufacturing of geared scooters getting relegated to history books, Bajaj Auto’s transformation was complete, one couldn’t have been more wrong. For, things were just warming up. It was a time when the Indian economy was on a tear and the Sensex on fire. The ‘India Growth Story’ had worshipers all around the world. Money was pouring into the country at a rate of knots. The rupee was appreciating on a daily basis and auto sales were hitting the roof. Ra- jiv Bajaj, however, contrary to popular wisdom, was looking at foreign shores as Bajaj Auto’s exports crossed the quarter million mark in FY2006. From thereon, the strategy was sim- Hyderabad free-market India. He knew it was time for a transition. But he perhaps didn’t know what to do. Luckily for Rahul Bajaj, the transition of India’s two-wheeler market took a few years and gave him the breathing space to build capacities. But by the turn of the century, the market had turned on its head. Rahul Bajaj noted in his annual let- ter to shareholders in the year 2000, “The structure of the two-wheeler market is changing at a rapid pace. Younger peo- ple and those with significantly greater purchasing power now constitute an im- with geared scooters? Observers claim that time seems to have run out for Ba- jaj Auto. According to Patil, “Setting up a 30,000/month scooter manufacturing unit will cost close to Rs.1,000-1,200 crore but more importantly, the com- missioning will take at least 24 months.” Bajaj Auto has lived India’s change. A look at its TVCs (from those popular jingles of the 80s trying to create an emo- tional bond with the buyer to the current ones that are more about specification) confirm this. And one would do well not betting against a company that has re-in- vented itself over and over again. Does it mean a new chapter is being quietly scripted in the corner office at the Bajaj Auto headquarters? The future of Bajaj Auto could be different. It could be about ‘also scoot- ers’. As much as we know Rajiv, he loves yoga and wants to grow his company in- side-out. We also know that he led the re- making story of Bajaj a decade back. No reason to believe therefore why he can’t adopt a top-down, organic approach to making change occur in Bajaj Auto’s build-and-sell strategy again. Only issue is, he doesn’t have nine years to decide and act. Not this time. portant segment of the market. The writ- ing is on the wall. Over the last five years, we have faced a stagnant, even declining market for our mainstay – the tradition- al, metal bodied, side-engine mounted, kick-start scooters.” However, not the one to throw in the towel, he ended the letter promising “rapid ramping up of ca- pacities for motorcycles...” THE TRANSITION Over the next five years, in every sin- gle annual letter to shareholders, Rahul Bajaj was seen pressing his case for mo- Growth rate of exports and net sales (%) Bajaj’s exports have risen almost 12x in the last 10 years Export as a percentage of sales Bajaj Auto’s total exports were worth Rs.8,199 crore in FY2014 45 12 40 10 35 RECONCILING AGAIN While Rajiv Bajaj continues to bet on motorcycles and seem to have turned his back on scooters forever, he would do well to learn from what his father did in the 90s and early part of the last de- cade. Can we even imagine what would have happened if Rahul Bajaj had not reconciled to the changing dynamics of the market in the 90s and continued 30 8 25 6 20 15 4 SCOOTER HAUNT With almost its entire focus on exports, Bajaj Auto is losing domestic market share by the day. Its domestic motorcy- cle sales fell by almost 15% in FY2014. This, when the motorcycle industry saw 10 2 5 0 0 FY05 FY06 FY07 FY08 FY09 FY10 FY11 FY12 FY13 FY14 FY05 FY06 FY07 FY08 FY09 FY10 FY11 FY12 FY13 FY14 Net Sales Value of Exports Volume Value jay@thedollarbusiness.com Source: Bajaj Auto Annual Reports Source: Bajaj Auto Annual Reports 26 THE DOLLAR BUSINESS II AUGUST 2014 AUGUST 2014 II THE DOLLAR BUSINESS 27
BIG IDEA WHAT? WHERE? WHY? BIG IDEA WHAT? WHERE? WHY? TIME TO LEARN FROM ANCIENT MARINERS Recent political turmoil notwithstanding, Indonesia has been an economic success story over the past couple of decades. Early to embrace liberalisation and foreign capital, the country was badly bruised during the East Asian Financial Crisis. However, since then this archipelago of 13,466 islands has seen a very stable but high growth rate. If that doesn’t make Indonesia an attractive destination for Indian exporters, millennia old trade ties and the in the last two years, Indonesia has turned a net importer (from almost always running a trade surplus) surely do BY DR. A. K. SENGUPTA Pura Ulun Danu Bratan, or Pura Bratan, located at the edge of Lake Bratan, is a famous Hindu and water temple in Bali, Indonesia. Several such temples in Indonesia are a testimony to the 2000-year-old India-In- donesia bilateral trade and cultural relationship 28 THE DOLLAR BUSINESS II AUGUST 2014 AUGUST 2014 II THE DOLLAR BUSINESS 29
BIG IDEA WHAT? WHERE? WHY? I Europeans arrived in Indonesia in the 16th century seeking to monopolise the commercial trade of commodities like spices. It was initially the Dutch in 1602, who established “The Dutch East India Company” and became the dominant European power in the region. The Jap- anese invasion and subsequent occupa- tion of the island nation during World War II ended the Dutch rule. The Japa- nese surrender in 1945 and subsequent developments heralded Indonesia’s in- dependence and national leaders like President Sukarno and General Suharto chartered a new course of economic and trade policies designed to help the island nation develop its true potential. It was in fact the dispensation of the “New Or- der Administration” policy brought into force by General Suharto that spurred investment from the Western nations and brought into focus the role of foreign investment as an engine of economic ad- vancement of the country. The late 1990s, however, witnessed a major setback to the rapidly growing In- donesian economy when it was hit hard by the escalating East Asian Financial Crisis. In the aftermath of the crisis, the government took custody of a significant portion of private sector assets through Indonesian merchandise trade The country posted trade deficit for the first time in CY2012 India-Indonesia trade India’s trade deficit with Indonesia widens as coal imports rise ndonesia comprises a group of is- lands stretching along the equator in South East Asia. The country’s strategic location fosters both in- ter-island and international trade. The acquisition of non-performing bank loans and corporate assets through debt re-structuring processes. Since 1998, the economy has seen an upswing, with sta- ble growth of 4-6%. ico, Indonesia, Nigeria and Turkey – it is an attractive investment destination due to favourable demographics. 250 16,000 14,000 INDUSTRIAL INDONESIA The industrial sector contributes 47% to the GDP of Indonesia. The two most important sub-sectors of the Industry in the country are mining and manufactur- ing – two pillars of the nation’s economy since the 1970s and the major engines of economic change and development during Suharto’s ‘New Order’ regime. Al- though the manufacturing sector seems to have lost its momentum after the Asian Crisis, it still is the most popular sub-sector in terms of attracting FDI and is followed by mining. Indonesia’s min- ing and manufacturing products include coal, oil, gold, automobiles, electronics, footwear, textile products, paper prod- ucts and furniture items. The first decade after the Asian cri- sis saw the industrial sector go through multiple periods of recession as foreign investors stayed away. However, success- ful navigation through the GFC saw for- eign investors regaining their confidence due to robust domestic demand spurred 200 12,000 10,000 THROUGH THE FLU Although Indonesia is regarded as a market economy, the government owns significant amount of the industrial base following the 1997 financial crisis. In fact, the successful structural reform, which followed the 1997 crisis, helped Indonesia escape the 2008 GFC (global financial crisis) almost unscathed. Since peaking in 2005, Indonesia’s unemploy- ment rate has also seen a perceptible de- cline. Concerns about runaway inflation have also ebbed, with inflation rate run- ning at around 4-5%. The nation’s debt- to-GDP ratio has also steadily declined from 83% in 2001 to less than 26% by the end of 2013 – the lowest among ASEAN countries, apart from Singapore, which has no government debt. Indonesia’s GDP per capita has risen almost five-fold in the past 50 years. Foreign trade has played an important role in this remark- able achievement. In the past 25 years, trade as a share of GDP has increased specifically, partly due to the country’s outward-oriented development strategy. Already ranked among the larger econo- mies in the world, Indonesia offers enor- mous promise for global investors. An integral component of the MINT – Mex- 150 8,000 100 6,000 4,000 50 2,000 0 0 CY04 CY05 CY06 CY07 CY08 CY09 CY10 CY11 CY12 CY13 FY05 FY06 FY07 FY08 FY09 FY10 FY11 FY12 FY13 FY14 Exports Imports Exports Imports Source: International Trade Centre; figures in $ billion Source: Ministry of Commerce, GoI; figures in $ million by a growing middle-class, low wages and a promising future. decline. The creation of the ASEAN Free Trade Area (AFTA), which encourages trade within the Asian region, is another factor that has given a directional shift to Indonesia’s trade patterns. Indonesia has almost always had a trade surplus in merchandise trade, with large exports to China, Japan, Singapore, Malaysia and US. But rising consumer- ism, thanks to a burgeoning middle class with high disposable incomes, has en- sured that Indonesia has recorded trade deficits to the tune of $1.63 billion and $4.06 billion in CY2012 and CY2013 respectively from an average surplus of $25.8 billion in the preceding five years. TRADE TRANSITION Till the 1970s, Japan was Indonesia’s dominant trade partner accounting for over 40% of its exports (mainly petro- leum) and 25% of imports. Although Ja- pan still remains a major partner, other nations have emerged in recent years. However, trade with Netherlands, which was of primary importance in colonial years when Indonesia was known as the Dutch East Indies, has shown a steady AS OLD AS THE EPICS Every year in the eastern Indian state of Odisha, a unique festival called ‘Baliya- tra’ or ‘Boita Bandano’ is celebrated with great spirit and fervour. Literally meaning ‘Voyage to Bali’, the festival is celebrated to mark the day when ancient Odia mar- iners would set sail to Bali, Java, Sumatra and Borneo (all in Indonesia). Similarly, in Bali, ‘Masakapan Ke Tukad’ festival is celebrated and like what is done in Odi- Top imports by Indonesia from India Mineral fuels, chemicals and cereals are Indonesia’s main imports from India 700 600 500 400 300 Porters unloading sacks of cement at a beach on Gili Trawan- gan island, a small island just off the north- west coast of Lombok, Indonesia. It’s an ideal destination for tourists looking for a remote island experience 200 100 0 A* B C D E F G H I J FY2013 FY2014 A) Mineral Fuels, Oils, Waxes; B) Organic Chemicals; C) Cereals; D) Nuclear Reactors, Boilers, Machinery; E) Oil Seeds, Medicinal Plant, Straw & Fodder; F) Auto & Auto Ancillary; G) Iron & Steel; H) Cotton; I) Electrical Machinery & Equipment; J) Residues and Waste from Food Industry Source: Ministry of Commerce, GoI; Imports of $1.49 billion in FY2013 vs. $1.54 billion in FY2014; Other figures in $ million 30 THE DOLLAR BUSINESS II AUGUST 2014 AUGUST 2014 II THE DOLLAR BUSINESS 31
BIG IDEA WHAT? WHERE? WHY? 2304), Cyclic Hydrocarbons (HS code 2902), Polymers of Propylene or other Olefins (HS code 3902), flat rolled prod- ucts of Iron or Non-alloy Steel (HS code 7208), Electrical Apparatus for Line Te- lephony (HS code 8517), Automobile Parts and Accessories (HS code 8708) and Cars (HS code 8703). If you add the potential export opportunities for Indian exporters in just these 10 categories, you arrive at a number which is over $47 bil- lion – nearly 17% of India total exports to the world in FY2014. Even if Indian exporters tap opportu- nities in these categories, the ambitious target of $45 billion set for India-Indo- nesian trade by 2015 can be achieved in no time. In fact, Indian FDI in Indonesia has also seen a steady rise in recent years. Prominent Indian companies/groups such as Tata Power, Reliance, Adani, L&T, GMR, GVK, SBI and Bank of In- dia have already established fully-owned subsidiaries and joint ventures in Indo- nesia. India and Indonesia had entered into an agreement for promotion of in- INDONESIA WAS ONE OF THE VERY FEW COUNTRIES THAT STAYED TOTALLY IMMUNE TO THE GFC OF 2008 An Indonesian floating model boat at ‘Masakapan Ke Tukad’ festival at Bali in Indonesia. The festival is similar to the ‘Boita Bandano’ festival celebrated in Odisha, India wherein toy boats are floated every year to commem- orate the sailing of first commercial ship to Bali from Odisha centuries ago sha, toy boats are floated in memory of maritime ancestors. In fact, India and Indonesia have shared two millennia of close cultural and commercial contacts. In modern times, both the then Indian PM Nehru and Indonesian President Su- karno collaborated closely in supporting the cause of Asian and African indepen- dence and later, economic cooperation. As a result, modern day trade between India and Indonesia always had a natu- ral edge and has grown five-fold in the last 10 years – from about $4 billion in FY2005 to close to $20 billion last fiscal. What’s interesting though is that In- dia-Indonesia trade has always been in favour of Indonesia, with India’s trade deficit against Indonesia galloping from just $1.3 billion in FY2005 to over $10 billion in FY2014. In fact, a proper look at all of Indonesia’s top trading partners reveals that India not only runs the high- est deficit that any country has against Indonesia, but also the number is so large that it was 50% more than the 2nd biggest – the US – in CY2013! Although this might sound discouraging to an In- A night market at Kuta, Bali. It is one of the most famous tourist destinations in Bali And, if history is a guide to the fu- ture, Indian exporters just cannot ignore a now-lucrative market that was one of India’s first export destinations. And going by the opportunities-at-hand, we know our that wrong! vestment in 1999 and a double taxation avoidance agreement (DTAA) in 2012. During the 2011 New Delhi visit of the Indonesian President, negotiations for India-Indonesia Comprehensive Eco- nomic Cooperation Agreement (CECA) were initiated. India and Indonesia have also recently agreed to expand coopera- tion in new sectors like film production. Certainly, things seems to be well in place for an exporter who wants to make the most of the opportunities that this archipelago of 13,466 islands offers. dian exporter, it simply means we haven’t tapped the Indonesian market the way we should have. ancestors weren’t exports were worth $67.07 billion and Indonesian imports were worth $27.85 billion, India’s exports to Indonesia were worth just $180.60 million – a $27.67 billion opportunity. Another glaring opportunity is cotton (HS code 5201). In CY2013, while India exported $4.51 billion worth of this commodity and In- donesia imported $1.34 billion worth of the commodity from across the globe, India’s exports to Indonesia were worth just $62.3 million. If this makes you think that Indian exporters are losing big time, here’s are some more products that will strength- en your belief. Other products/com- modities that offer such billion dollar opportunities are Wheat & Meslin (HS code 1001), Soybean Oil Cake (HS code editorial@thedollarbusiness.com LOW HANGING FRUITS A detailed The Dollar Business Intelli- gence Unit analysis reveals that there are 10 products, where Indian exporters are missing out on at least a billion dollar worth of opportunities by not focus- ing on Indonesia. To arrive at this list, we analysed all products (broken down to 4 digit HS codes), where Indonesian imports were worth at least $1 billion, Indian exports were worth at least $1 billion and still there existed an oppor- tunity of at least $1 billion in CY2013. Right on top of this list is petroleum oils (HS code 2710), where although Indian Dr. A. K. Sengupta Chief Consulting Editor, The Dollar Business; Former Dean of The Indian Institute of Foreign Trade (IIFT), New Delhi Demand-supply gap analysis: Indian exports – Indonesian imports Amongst Indonesia’s top 20 import products, only across four categories does India’s export value cross the $100 million mark HS Code Product Total Imports from India Potential for Indian exports Enhancement Factor # Imports 2710 2709 8517 8708 2711 8471 1001 8703 7207 2304 1701 2902 7208 8542 3902 5201 3901 8431 2901 7304 Petroleum Oils (not Crude) Crude Petroleum Oils Electrical Apparatus for Line Telephony Parts & Accessories of Motor Vehicles Petroleum Gases Automatic Data Processing Machines Wheat & Meslin Cars Semi-finished products of Iron or Non-alloy Steel Soybean Oil Cake and other solid residues Cane or Beet Sugar and Chemically Pure Sucrose Cyclic Hydrocarbons Flat rolled products of Iron Electronic Integrated Circuits and Micro-assemblies Polymers of Propylene Cotton (not carded or combed) Polymers of Ethylene Machinery Parts Acyclic Hydrocarbons Tubes, Pipes and Hollow profiles (seamless or iron) 27,850,878 13,585,810 5,291,232 3,218,276 3,112,953 2,443,779 2,439,987 2,231,190 2,048,443 1,926,982 1,730,657 1,666,981 1,610,153 1,579,274 1,458,528 1,346,307 1,343,586 1,253,625 1,227,977 1,180,630 180,642 27,670,236 13,585,810 4,973,026 3,143,233 3,112,953 2,443,461 2,318,455 2,176,565 2,042,372 1,848,352 1,730,657 1,345,885 1,606,070 1,579,067 1,412,120 1,284,045 1,343,059 1,248,217 1,209,023 1,170,496 153.2 NA 15.6 41.9 NA 7,683.8 19.1 39.8 336.4 23.5 0 318,206 75,043 0 Low hanging fruits – count and weigh the ‘massive’ opportunities Items imported by Indonesia in large numbers, exported by India in large numbers...yet offering massive opportunities 318 121,532 54,625 6,071 78,630 HS Code Product Indonesia’s imports from the world India’s exports to the world India’s Opportunity exports to Indonesia 0 NA 4.2 Wheat & Meslin Soybean Oil-Cake and Other Solid Residues Petroleum Oils, Not Crude Cyclic Hydrocarbons Polymers of Propylene or of other Olefins Cotton (not carded or combed) Flat rolled products or Iron or Non-alloy Steel Electrical Apparatus for Line Telephony Parts and Accessories of Motor Vehicles Cars (including Station Wagons) 321,096 4,083 1001 2304 2710 2902 3902 5201 7208 8517 8708 8703 2,440.0 1,927.0 27,850.9 1,667.0 1,458.5 1,346.3 1,610.2 5,291.2 3,218.3 2,231.2 1,260.3 2,860.3 67,075.2 2,671.6 1,568.5 4,513.4 1,913.9 3,444.6 3,912.8 5,556.5 121.5 78.6 180.6 321.1 46.4 62.3 4.1 318.2 75.0 54.6 2,318.5 1,848.4 27,670.2 1,345.9 1,412.1 1,284.0 1,606.1 4,973.0 3,143.2 2,176.6 393.4 7,628.3 30.4 20.6 2,548.5 230.8 63.8 115.5 207 46,408 62,262 527 5,408 18,954 10,134 Source: International Trade Centre; all figures in $ thousands (for CY2013) # Enhancement factor is the number of times Indian export value has to be raised, in the absence of policy restrictions and latent demand, from the current levels to meet total demand of the destination market (Indonesia) Source: International Trade Centre; figures for 2013 ($ million) # Criteria: Indonesian imports of more than $1 billion, Indian exports of more than $1 billion, opportunity of more than $1 billion 32 THE DOLLAR BUSINESS II AUGUST 2014 AUGUST 2014 II THE DOLLAR BUSINESS 33
GLOBAL MANAGER “WE ENSURE OUR PRODUCTS DON’T BECOME TOUCH-ME-NOTS” ANISH GOEL, MANAGING DIRECTOR, VICTORINOX INDIA Chances are that you own one or aspire to own one. Having got its name from the Yankees in Europe after World War II, the Swiss Army Knife is probably the only knife in the world, which while carrying, buying or gifting doesn’t raise eyebrows. To know more about the business of this nifty collectible, The Dollar Business caught up with Anish Goel, Managing Director of Victorinox India, who spoke his mind on a host of issues ranging from his flagship product, to Indian manufacturing and the new government. Excerpts: INTERVIEW BY PURBA DAS 34 THE DOLLAR BUSINESS II AUGUST 2014
THE SECRET INGREDIENT T-SHIRTS DRESSING UP THE WORLD W ed an indelible mark in our minds, the makers of all of these brands converge to one destination – Tirupur in Tamil Nadu – in order to get their products tai- lor-made and which live up to their de- mands of high-quality standards. Nike, Adidas, Katzenberg, Cutter & Buck, Van Heusen, Fila and Arrow also source their products from this small but vibrant town located just 47 km away from an- other popular industrial and textile hub popularly known as the Manchester of South India – Coimbatore. Here is another interesting fact! Some of the top labels in the garments’ arena (especially in the T-shirts segment) have hat do famous brands like Zara, Gap, H&M, Man- go, El Corte, Desigual and Tommy Hilfiger have such confidence on Tirupur’s textile quality and expertise (of the manufac- turers in meeting customised demands), that right from raw material procure- ment to producing finished products is done there. All that these importers from across the world have to do is emboss their brand labels! of its contribution to knitwear exports from India and also as the Dollar City – because of its’ position as an export hub. From being an obscure town with cot- tage knitting units to becoming a world famous cotton garments manufacturing location, the metamorphosis, like ev- ery success story, has a very interesting genesis. According to official records, Tirupur’s direct exports started with It- aly. Verona, a garment importer from Italy, came to Tirupur in 1978 through Mumbai-based exporters to buy white T-shirts. He was so impressed with the quality of the product that he came to Tirupur the following year for further purchases. Verona can also be consid- ered as Tirupur’s brand ambassador, since he was instrumental in bringing European business to Tirupur. In 1981, European retail chain C&A started plac- ing orders and the trickle to Tirupur soon became a big pour with big brands and retail outlets from across the globe, especially from US and Europe, queuing up to procure garments from the manu- facturing units located there. TIRUPUR ACCOUNTS FOR ABOUT 65% OF INDIA’S COTTON GARMENTS AND ALMOST ALL OF ITS T-SHIRT EXPORTS in common? Other than having creat- 90% of cotton tees exported from India are made in a lesser-known South Indian town called Tirupur, a.k.a. the “Dollar City”. 62% of Americans claim to own at least ten tees, and odds are high that some of them were shipped from Tirupur. 600% is the average appreciation in the price of a tee by the time it the reaches First World buyers in love with American or European tags. Numbers that make for an export idea ITALIAN CONNECTION Tirupur fits the tag of the T-shirts Cap- ital of the world to the T. The tranquil town resonates with riveting but serene rhythm of knitting machinery emanat- ing from thousands of apparel units dot- ting the topography of this dominant, if not exclusive, T-shirt domain of the country. The many sobriquets attached to it provide an eloquent narrative of this thriving town. Tirupur is also known as the knitwear capital of India – because wards manufacturing garments. Most units operating in Tirupur are WTO compliant, which is a prerequisite for exports. Statistics substantiates Tirupur’s hallowed status as the most sought after destination for importers. According to Raja Shanmugham, Chairman of Con- federation of Indian Industry (Tirupur District), the city accounts for almost 65% of India’s cotton garment exports. “Garment exports business from Tiru- pur is valued at Rs.18,000 crore,” he tells The Dollar Business. Most units here are involved in cotton T-shirt production. In fact, a lion’s share, i.e., around 80% of all garments exports from Tirupur com- prise of cotton T-Shirts. According to the Ministry of Commerce (GoI), cotton T-shirts exports from India in FY2014 were worth $1,740.25 million, of which Tirupur’s share is estimated to be about 80-90%. The garment industry in Tiru- pur recorded exports worth Rs.8,646.52 crore in the first nine months of FY2014, registering a 30% y-o-y growth. In fact, BY SATYAPAL MENON Women busy manufacturing T-shirts at one of the hundreds of manufacturing units in Tirupur, a major textile and knitwear hub in Tamil Nadu, India NUMBERS TALK The 27-square-kilometer city, with a population of around 7 lakh, has about 6,000 units involved in knitwear pro- duction. In fact, Tirupur could be also referred to as the only exclusive export city with an entire industry oriented to- Top overseas destinations for Indian T-shirts Most of the T-shirts manufactured in India are exported to US and Europe Types of T-shirt exported from India (by fabric) Over 70% of the T-shirts exported from India in FY2014 were made of cotton 24% 23% 26% 4% 1% 1% 2% 3% 3% 3% 3% 6% 13% 71% 10% 7% USA UK Spain Canada UAE France Italy Other Germany Netherlands Belgium Cotton Artificial Fibres Other Synthetic Fibres Silk & Wool Source: Ministry of Commerce, GoI; Breakup for FY2014 Source: Ministry of Commerce, GoI; Breakup for FY2014 36 THE DOLLAR BUSINESS II AUGUST 2014 AUGUST 2014 II THE DOLLAR BUSINESS 37
THE SECRET INGREDIENT T-SHIRTS “Cotton pricing policy is impacting our growth” World’s top T-shirt exporters As with almost everything else, China dominated T-shirt exports in CY2013 ON AN AVERAGE, A T-SHIRT MAKER IN TIRUPUR MAKES A PROFIT OF ABOUT RS.200 FOR EVERY T-SHIRT EXPORTED 20 States. About 7% of the orders are from Europe. There is a great demand for our products in the sporting fraterni- ty because of their flexibility and sweat absorbing capability. TDB: At what price do you sell your T-shirts and what is the tag attached to the same in United States? BV: On an average, our FOB price is about $7.5 per T-shirt. The same is sold in American retail outlets at almost six times the selling price, i.e., around $50. TDB: Are there any grey areas in terms of government policies and support which are affecting the earn- ings performance and productivity of the industry? BV: There are some major factors that are affecting and impacting our growth. It is quite strange and ironi- cal that despite India being the second largest producer of cotton, domestic garment industry has to procure cot- ton at a price which is higher than that in the international markets. I do not see any logic for this over-pricing. My products are made of 50% cotton and the rest is viscose churned out of bamboo. There is munificent bamboo resources in India, but there is a ban on the use of bamboo. So again, we have to rely on imported viscose. We have opted for viscose from bamboo as an alternative for polyester. Reliance In- dustries has monopoly over polyester fabric and its pricing. Here in India, polyester is priced higher than that in international markets. Even if we have to import polyester fabric, there is a catch. Government has imposed an- ti-dumping duties on import of polyes- ter. This means we either procure from the Indian markets at a higher price or purchase it from the international markets by paying anti-dumping du- ties. Most of the garment manufac- turers are subjected to these problems, resulting in high cost of production. 18 16 14 12 10 8 revival and rejuvenation after it expe- rienced a slump in production follow- ing the Madras High Court directive in 2011 to close down all pollution causing units, which resulted in operations in about 173 units coming to a halt. Later, after the units installed Effluent Treat- ment Plants and restarted production, the industry is back on track to retain its high-volume track record. According to Milton Ambrose John, Vice President, TEKIC and Managing Director, Cotton Blossom (India) Private Limited, “The units here have achieved Zero Level Dis- charge (ZLD) and we will ensure that it is sustained and maintained.” 6 4 2 B. Vijayaragavan Managing Director, B. S. Apparel 0 China Bangladesh Turkey India Germany Other A high-speed knitting machine at work in a T-shirt making unit in Tirupur. One of the main strengths of Tirupur is the ability to adapt to ‘dynamic markets’ TDB: What is that unique feature that makes T-shirts manufactured by your company stand out in the crowd? BV: Two years of natural fibre research and textile engineering research went into our products. Our research re- vealed that viscose produced from bamboo was an ideal alternative to polyester. Among the many disadvan- tages of polyester are the lack of com- fort and flexibility. Our T-shirts are made from an amalgamation of 50% cotton and 50% viscose. The Bamboo Performance Technology combines the best of nature with a patent pending finishing process – Bamco – to release the innate performance characteristics that exist in the fibre. Our products have the inherent properties to reg- ulate temperature, absorb moisture rapidly and allow superior breathabil- ity. Apart from these features, they are exceptionally soft and extremely light and odour-free. Our products are cat- egorised as UPF 50+ (Ultraviolet Pro- tection Factor). A garment with a UPF of 50 only allows 1/50th of the UV radiation falling on the surface of the garment to pass through it. In other words, it blocks 98% of the UV radi- ation. Source: International Trade Central; Values for CY2013 ($ billion) the performance of just one player in the T-shirts’ segment – Eastman Exports Global Clothing Pvt. Ltd. – gives an idea of the demand for the Tirupur brand. Eastman clocked in a business of $250 million during FY2014. finishes and washes. We are also capa- ble of handling any quantum. Moreover, we have a reliable supplier base, which makes it all the more convenient. All these qualities make it the most sought after destination.” The quality of Tirupur T-shirts could well be gauged from the fact that its major markets are the very fastidious and high quality-conscious Europe and US. “Besides EU, the volume business is from American retailers and importers. Approximately 50% of the business is from countries other than Europe. Now all big retailers/importers from the EU have started thinking of procuring their merchandise from the fully equipped compliance factories here after the Rana Plaza accident in Bangladesh. They also want to de-risk themselves by splitting orders across different countries. In fact, if the India-EU Free Trade Agreement (FTA) is signed, our business will jump due to lower tariff,” Chandran tells The Dollar Business. Speaking about the source of raw ma- terial required for the manufacturing of the garments, Chandran says, “All the raw materials are being sourced from our own factories, except mélanges and dyed yarns which are being sourced from countries in the northern hemi- sphere. Some sewing and packing trims are being sourced from Far East and we get them in accordance with the custom- ers’ specifications.” The production is so prolific that the average quantum rang- es from an average of 1.5 lakh pieces a month in a small unit to a mind boggling millions of pieces in big units. “Our com- pany’s capacity is about 8 million pieces a month,” adds Chandran matter-of-factly. TRULY GLOBAL So, what is so unique about Tirupur T-Shirts that attracts world’s top brands? According to N. Chandran, Vice-Pres- ident, Tirupur Exporters’ Association and Chairman, Eastman Exports Global Clothing Pvt. Ltd., “The industry here is famous for lighter weight, soft fabrics, higher count fabrics, multi processed products apart from being equipped with all kinds of prints, applications, embroideries, finishes like performance PARADOX There are also other issues faced by Tiru- pur’s T-shirt manufacturers, which if ad- dressed by policymakers, would take this industry to an altogether different level. According to Chandran, “In India, the cost of fibre is very high and we do not have different varieties. Hence, if we set zero import duty on fibre, we can have all facilities from spinning and knitting to weaving process to make world-class fabric. We can compete with other coun- tries like China and Indonesia. Currently this is a big problem.” And, here is the paradox in govern- ment policy. “The manufacturers here are forced to purchase cotton and yarn from outside since local prices are very high. The irony is that China produc- es yarn from cotton imported from In- dia and we buy the same at a price that is cheaper than the prevailing price in India. If India stabilises cotton and yarn prices to a level lesser than that abroad, our production costs can be reduced considerably,” John points out and adds “I would also like to suggest to the gov- ernment to ship cotton bales from Guja- India’s T-shirt exports Indian T-shirt exports almost hit $2.5 billion and 80 crore pieces in FY2014 3,000 900,000 A WIN-WIN GAME As far as market equations are concerned it is a win-win proposition for both the manufacturer and the buyer. “The FOB price of some of the best T-shirts made in Tirupur is about $7.5. But in US re- tail markets, it is sold at about $45-50! On an average, our products are priced five to six times higher by our US buy- ers,” B. Vijayaragavan, MD, B. S. Apparel and Executive Member, Tirupur Export Knitwear Industrial Complex (TEKIC). The industry is still in a process of 800,000 2,500 700,000 2,000 600,000 500,000 1,500 400,000 TDB: What is your actual production capacity and which are the biggest ex- port destinations for your T-shirts? BV: Our output is between 70,000 – 100,000 pieces per month. About 90% of our products are exported to United 1,000 300,000 200,000 500 100,000 0 0 FY05 Value FY06 FY07 FY08 FY09 FY10 FY11 FY12 FY13 FY14 Volume Source: Ministry of Commerce, GoI; Value in $ million (Left axis); Volume in thousands 38 THE DOLLAR BUSINESS II AUGUST 2014 AUGUST 2014 II THE DOLLAR BUSINESS 39
THE SECRET INGREDIENT T-SHIRTS rat by sea route to Tuticorin Port. Pres- ently, we are transporting cotton bales by road which is very costly and adding to our production cost. In fact, the govern- ment should launch an exclusive ship- ping facility for this purpose.” The T-shirts industry in Tirupur is facing another rather unusual problem – manpower scarcity and job-hopping by workers! In fact, this problem is affecting productivity levels to such an extent that many have expressed concerns about not being able to meet demand. According to John, “There is a huge demand for T-shirts from international buyers, but we are not able to produce the required quantum because of shortage of man- power, specifically skilled. The problem is further aggravated by continuous job-hopping by workers.” In fact, the manpower problem is so grave in this la- from Tirupur witnessed a drop of 7% y-o-y, thanks to the Madras High Court directive to close down pollution causing units), exports from Tirupur are back on track reporting 15 growth y-o-y in FY2014. And with the Finance Minister proposing, in Union Budget 2014, to in- crease the duty free entitlement for im- port of trimmings, embellishments and other specified items from 3% to 5% of the value of their export for readymade garments only makes the situations bet- ter for exporters of T-shirts from India. The next time you flaunt a branded tee, chances are that it may be from your very own “Dollar City”. Doesn’t make you feel good, but for once, spare some admiration for the local artisan who made it! bour intensive industry that output from almost all units is well below capacity. Supply is constantly trying to play catch up to demand. “We have the capacity, expertise and raw material resources to meet the high and consistent demand, but the industry here is encountering almost a 50% manpower shortage, both skilled and unskilled,” B. M. Boopathi, CEO, TEKIC, tells The Dollar Business. The labour shortage is also reflected in the fact that many of the units out- source their works to households. Of course, it also exhibits the fact that the tradition of knitwear and embroidery is an art embedded in hearts and culture of the inhabitants of this town. Inter- estingly, one reason for the increasing manpower crunch is also the fact that many individuals, after working for a few years at various units in Tiru- pur, end up becoming entrepreneurs themselves! And why not? On an aver- age, a T-shirt maker in Tirupur makes a profit of about Rs.200 for every T-shirt exported. Be that as it may, Tirupur continues to shine on India’s export map despite such challenges. Although T-shirt manufac- turers from Tirupur compete with ex- porters from manufacturing giants like China and countries with “Least Devel- oped Country” status like Bangladesh, which enjoy zero duty advantage, their ability to adapt quickly to ‘dymanic mar- kets’ make them popular among foreign buyers. Apart from that the presence of all allied units within the 27 km radius of this city helps it shorten the produc- tion period and meet the deadlines for deliveries. After a brief lull (in FY2013 exports After being forced to shut down because of a directive of the Madras High Court in 2011, most T-shirt making units in Tirupur have now achieved Zero Liquid Discharge Vision 2020 Tirupur Knitwear Industry recently submitted a Vision 2020 document to the Prime Minister spelling out the strategies to boost apparel exports from the present Rs.15,000 crore to Rs.1,00,000 crore by 2020. This target, if achieved, could, to a considerable extent, reduce India’s trade deficit. A master-plan has been designed, which seeks the establishment of a national research and training institute for the apparel industry. A comprehensive knitwear research institute could enable the garment industry to document the expertise and experience of Tirupur and replicate the successful cluster formula in different cities of the country. This institute can be established in collabora- tion with the Tirupur based NIFT-TEA Institute (National Institute of Fashion Technolo- gy – Tirupur Exporters’ Association). Apart from this, the document also suggests setting up of a state-of-the-art design studio to cater to this hugely design dependent industry. satyapal@thedollarbusiness.com “Our quality is much superior to that of Bangladesh” “Our USP is the ability to cater to dynamic markets” TDB: China continues to dominate glob- al T-shirt exports. What is the difference between garments manufactured here and those produced in China? BMB: China is a designer’s market – they design garments according to their own concepts, which are in great demand. In India, specifically in Tirupur, it is more customised or made-to-order design- ing. In our case, the buyers prescribe the specifications. China is a seller’s market and India is a buyer’s market. Even Ban- gladesh exports more than us because of three primary advantages. Firstly, it en- joys the ‘least developed country’ status. Secondly, there products are cheaper as compared to India because of cheaper la- bour. Thirdly, it produces in massive vol- umes. But in terms of quality our prod- ucts are superior to that of Bangladesh. objective of ensuring that quality and time-bound commitments are met, and deliveries are according to the dynamic requirements. This synergy is our USP. TDB: Job-hopping is considered to be a major problem impacting the in- dustry’s performance. So, how do you manage to cater to dynamic markets? MS: As pointed out, the synergy among the various units is our strength. Al- though there is migration of workers from one unit to another, the positive side to this trend is that the experienced and skilled human resources remain within the Tirupur cluster. This enables us to outsource various components that go into the manufacturing of our prod- ucts, whenever we or any other unit in Tripur encounters manpower crunch. are directly employed in TEKIC. On an average, each unit has the capacity to churn out around 5,000 pieces per day. The annual output capacity from TEKIC is valued at Rs.600 crore. changing even every month and if the products are not delivered within that month, they become redundant. It is a challenge that only we can meet. Only Tirupur is equipped with the capability, capacity and expertise to handle such de- mands. The Tirupur cluster, as we call it, has the track record for adaptability. TDB: What is the share of T-shirts in the total production at TEKIC? BMB: A majority of the units, i.e., 80- 90% are into manufacturing T-Shirts. Tirupur’s share in India’s total T-shirts export is between 60-70%. TDB: So, what is the capability that Tirupur has, which other parts of the country doesn’t have, to meet such fre- quent changes in demand? MS: To cater to the dynamic demands for timely deliveries, there is a need for synergised efforts among various units involved in the production. We have spe- cialised in the methodology to produce a product unique to a specific season. Here in Tirupur, we are like one big one-stop- shop where you have units specialised in various areas of garment production – ranging from designing and dyeing to customising the products according to market demands. We work as a close- ly knit group, where we outsource our products to each other, with the prime B. M. Boopathi CEO, Tirupur Export Knitwear Industrial Complex (TEKIC) Raja M. Shanmugham Managing Director, Warsaw International; Chairman of CII Tirupur District Council TDB: How many manufacturing units are operating in Tirupur Export Knit- wear Industrial Complex (TEKIC) and what is their output? BMB: TEKIC is spread over 100 acres of land and was established in 1990 for micro, small and medium enterprises (MSME) export oriented units (EOUs). Presently, there are 189 units related to knitwear production operating here in- cluding 60 EOUs. A majority, i.e., 75% of them comprise of small units and a large chunk of the contribution is from these units. More than 20,000 people TDB: There was a slump in production activity after the Madras High Court di- rective to close down pollution causing units. What was the impact of the direc- tive and how did the revival begin? BMB: 752 units, which were doing quite well before, closed down in Tirupur fol- lowing the Madras High Court directive. There was a total shutdown and consid- erable decline in productivity and out- put. But after the units started installing Effluent Treatment Plants and achieved Zero Liquid Discharge, the industry here is experiencing a turnaround. TDB: What is so unique about Tirupur products that major brands across the globe converge to this city? MS: There are two kinds of markets – static and dynamic. Static means a prod- uct’s saleability could last over a period of time and through various seasons. It is the dynamic market that is more challenging, because we have to cater to frequent and seasonal changes from time to time. The make and nature of the product have to be changed according to seasons. In fact, the market demands are TDB: Apparel exports from India is quite minimal if one considers the potential. What’s the problem? MS: India’s share is indeed dismal, de- spite us being the 2nd largest producer of cotton. We are way below even Ban- gladesh, which has a 12% share in global exports. I attribute India’s position to a total lack of understanding of the coun- try’s prospects and lack of co-ordination among policymakers. TDB: Destination Tirupur seems to be an oft heard buzz from big brands. Why? BMB: Manufacturers in Tirupur have a reputation for maintaining high qual- ity standards sought by international markets. Apart from this, we are able to cater to dynamic market requirements through timely deliveries. We are able to meet the deadlines for deliveries because of the presence of all allied units within the 15 km radius of this city. 40 THE DOLLAR BUSINESS II AUGUST 2014 AUGUST 2014 II THE DOLLAR BUSINESS 41
IMPORT’ONOMICS LENTILS DESPITE MSP FOR LENTILS ALMOST DOUBLING IN THE LAST FEW YEARS, THERE HAS BEEN NO JUMP IN PRODUCTION A combine unloading a harvest of lentils onto a truck in Canada. Canada is the world’s largest exporter of lentils to the global marketplace, selling to over 100 countries every year LENTILS – A BOWLFUL OF DELIGHT! ered around 9 to 10 lakh metric tonne since FY2007 without any significant in- crease despite a substantial hike in min- imum support price (MSP) for it from Rs.17,000/tonne in FY2009 to Rs.29,000/ tonne in FY2014. Even this big uptick in MSP coupled with a massive surge in de- mand has failed to motivate farmers to take up lentils production in a significant way, primarily because of the govern- ment’s bias in favour of rice and wheat. The government’s procurement policy is also skewed, which is reflected in our public distribution system and populist commitments of distributing wheat and rice to the poorer sections of the society at subsidised prices. Further, because of ever rising domestic consumption (thanks to changes in food habits and no reversal in our population trend) it has become almost impossible to depend solely on domestic production. Experts believe the situation is not going to im- prove despite the government rolling out several incentives for lentils’ growers. According to the International Cen- ter for Agriculture Research in the Dry Areas (ICARDA), during the last three decades, lentils yield has increased by just 34% despite revolutionary chang- es in cultivation techniques. While the global average yield of lentils is around 820 kg/hectare – the same in Canada and US stands at around 1,800 kg/hectare – in India it is just 600 kg/hectare. Inter- estingly, in CY2002, India used to com- mand almost 34% global market share in lentils production, while Turkey and Canada had a 12% and 9% share respec- tively. But higher productivity in Canada prompted farmers in that country to take up lentils seriously. This, coupled with higher technological advancement in the farm sector, has now made Canada by far the biggest lentils’ producer in the world. This means that just in a decade, since 2002, Canada’s share in global lentils production has surged from 9% to 32%, while that of India has dropped almost 14 percentage points. Some of the key reasons attributed to India’s decline in market share and low productivity are lack of seed replacement with high yielding suitable varieties and non-availability of quality seeds, coupled with archaic production techniques. Snapshot of lentils cultivation in Canada Canadian lentils supply is expected to increase by over 200 kilo ton in FY2015 Lentils Area Seeded (kha) Area Harvested (kha) Yield (T/ha) Production (T) Total Supply (Kilo Ton) 2,196 Imports (Kilo Ton) Exports (Kilo Ton) FY14 FY15 E 968 954 1.97 1,881 1,157 1,135 1.63 1,850 1,985 It’s an integral part of daily meals, particularly in north India. While we are the second largest producer of red lentils in the world, we are also its biggest importer. And with government policies still focussed on just rice and wheat, importing lentils is not only a lasting but also a lucrative business proposition N many, India is actually the biggest im- porter of lentils in the world. The coun- try imported close to $450 million worth of this edible pulses in FY2014, most of it coming from Canada. What’s even more interesting is the fact that India is actual- ly the second largest producer of lentils in the absolute short run. 8 10 1,600 1,550 Source: Agriculture and Agri-food, Canada BY SACHIN MANAWARIA NORTHERN DOMINANCE When it comes to lentils production in India, Uttar Pradesh, Bihar and Mad- hya Pradesh account for almost 80% of India’s production of lentils. Although pulses and lentils are grown during both the Kharif as well as the Rabi seasons, more than two-thirds of India’s lentils are produced during the Rabi season. During FY2014 Rabi season area under pulses and lentils cultivation was at a record level, mainly driven by last year’s ext time you savour masoor dal, odds are high that it would have been cultivated in a farm in faraway Canada. Although it might sound surprising to in the world, next only to Canada! So, this increasing love for lentils means that domestic production has been found to be increasingly inadequate, resulting in ever higher imports. A recent report by Confederation of Indian Industry (CII) titled ‘Overcoming Indian Pulses Cri- ses’ reveals that while India’s population grew at a CAGR of 2% during 1971-2008, pulses production grew at a meagre 0.7% – something which cannot be reversed Even in terms of nutritious value, len- til seeds are high in carbohydrate, fiber and protein content which is why it is so popular in India, particularly among vegetarians. What also goes in its favour is the fact that it is considerably cheap- er than other sources of protein. In fact, lentil is considered as one of the oldest food legumes known to mankind. THE INDIAN STORY Domestic production of lentils has hov- 42 THE DOLLAR BUSINESS II AUGUST 2014 AUGUST 2014 II THE DOLLAR BUSINESS 43
IMPORT’ONOMICS LENTILS Top lentils producers (2002) India used to dominate lentils produc- tion till CY2002, with a 34% share Top lentils producers (2012) Canada’s share in lentils production has jumped 20 percentage points in 10 years LENTILS YIELD IN THE UNITED STATES AND CANADA IS ALMOST THREE TIMES THAT OF INDIA’S 600 KG/HECTARE Profit estimate for red lentils imports Zero duty on lentils imports since 2012, has made margins even more lucrative Lentils production in India Domestic production has failed to keep pace with demand 20% 1,050 1,000 34% Cost of Lentils (CAD/Tonne) * Freight & Insurance (CAD/Tonne) ** CIF Import Duty ID (0%) # Cess Final Cost Final Cost (INR) *** Wholesale Price in India * Profit Profit Margin (%)**** 958.00 10.50 968.50 35% 39% 950 9% 900 0.0 0.0 prices of lentils may perhaps rise in the global markets as Canada is the biggest exporter of the lentils in the world. 850 968.5 800 54,236.00 63,000.00 8,764.00 16.16 12% 32% 19% 750 FY08 FY09 FY10 FY11 FY12 FY13 FY14 THE PROTAGONISTS Despite supply issues Canada is expected to achieve its exports target of 16 MMT to India, Turkey and EU. In fact, Canada exported lentils worth $352 million to India during FY2014 and $230 million a year before that. India has been import- ing nearly 75% of its lentils requirement from Canada alone during the last few years. Another 10% is sourced from Aus- tralia and US respectively. According to the US Department of Agriculture (USDA), the area under lentils production in US during 2014-15 is forecast at 0.3 million acre, down by 12% as compared to the previous season. This, due to lower area seeded in one major lentils’ producing state – Mon- tana. Assuming yields to stay normal, US lentils production is projected to be around 0.2 million tonne – down about 19% from last year. Similarly, the Australian Bureau of Agricultural Resource Economics and Science (ABARES), forecasts a decline of nearly 30% in lentils production this year, primarily due to a significant drop in yields. However, this is hardly going to have any negative impact on exports to India as only 10% of our country’s re- quirements are imported from Australia. For the rest of the world, production forecasts for this season are relatively good. However, it too will not have any adverse impact on Indian imports even in case of a marginal crop failure due to scanty rainfall in our country. India Turkey Canada Other India Turkey Canada Other Source: Ministry of Agriculture, GoI; figures in thousand tonne Top lentils producing states in India Uttar Pradesh is by far the biggest lentils producing state in India Source of Indian lentils import In FY2014 more than 3/4th of Indian lentils imports were from Canada good monsoon which was well spread across the country. This helped water levels, necessary for Rabi crops, to rise apart from augmenting irrigation capac- ities in lentils’ growing states. However, the monsoon deficit of 45% reported by the India Meteorological Department (IMD) during the first week of June 2014 presents a grave scenario for lentils growers for the upcoming Rabi season. A near drought like situation would further adversely impact lentils productivity, forcing India to go in for more imports. India’s export share may also go down further, if the rain gods fail to deliver in quick time especially in the pulses and lentils growing states. ALL IN NUMBERS According to the Directorate of Eco- nomics and Statistics (Ministry of Agri- culture, GoI), during FY2014, India pro- duced nearly 19.57 million metric tonne (MMT) of pulses (including lentils) and imported another 3.04 MMT. The Min- istry of Commerce is already expecting an increase in imports of pulses to 3.41 MMT during FY2015. And the expecta- tion is that within the pulses pack lentils imports will continue to grow at a CAGR of 20% – the trend for the last five years. On the other hand in Canada, lentils pro- duction surged by 22% during the 2013- 14 season as compared to the previous year. This, despite the fact that the area under harvest was down by about 5%. However, Canada’s current existing sup- ply stands at 2.2 MMT, down by around 9% from the 2013 levels. This means * TDB Intelligence Unit ** Freight and insurance cost/tonne from Victoria to Mumbai *** Assuming exchange rate of CAD/INR 56 # Import duty on lentils is zero via CBEC notification 12/2012 **** Margins may vary because of fluctuation in price of lentils 4% 5% 1% 4% 2% 10% 10% 44% 19% 78% 23% Canada USA Australia Other UP West Bengal Other Bihar Rajasthan Madhya Pradesh Assam Source: Ministry of Commerce, GoI; AAFC, APEDA India and US together imported over $800 million worth of lentils in CY2014. The next two – Australia and Uzbekistan – put together, imported less than $100 million worth of lentils India’s lentils imports India imported over 8x more lentils in FY2014 as compared to FY2012 450 consumption patterns and the ever rising vegetarianism. Moreover, being a devel- oping country where food prices do mat- ter to a majority of the population, lentils consumption can only head northwards given the fact that it is cheaper than most other major popular sources of protein. In fact, at current prices, profit margins in lentils imports are also relatively high ranging from 20% to 30%. Further, the stagnation in lentils production during the last two decades also presents an ex- cellent opportunity for entrepreneurs to explore this option and capitalise on it in the years to come. Interestingly, while WHO recommends per capita consump- tion of at least 80 gm of pulses when it comes to adult Indians, our current aver- age is just 43 gm. This too makes a strong case for lentils imports and indicates prosperous times for those importing it! Are you one of them? 400 350 300 250 200 150 100 FEASIBLE OPTION Importing lentils from Canada appears to be a lucrative business given India’s 50 0 FY05 FY06 FY07 FY08 FY09 FY10 FY11 FY12 FY13 FY14 sachin@thedollarbusiness.com Source: Ministry of Commerce, GoI; figures in $ million 44 THE DOLLAR BUSINESS II AUGUST 2014 AUGUST 2014 II THE DOLLAR BUSINESS 45
EXCLUSIVE INTERVIEW “LENTILS SHOULD BE INCLUDED IN INDIA’S PDS AND FSA” PRADEEP GHORPADE, CEO, INDIAN PULSES AND GRAINS ASSOCIATION SUBSCRIBE NOW! The Dollar Business magazine Read this exclusive platform on foreign trade and get an unbeatable edge in the business of exports-imports. Welcome to globalisation! SPECIAL DISCOUNT ON OFFER! SUBSCRIPTIONS GET UP TO 65% From being the world’s largest producer to becoming the world’s largest importer, India has been on a downward spiral as far as net lentils trade is concerned. To figure out what needs to be done to reverse the trend The Dollar Business caught up with Pradeep Ghorpade, CEO, Indian Pulses & Grains Association Print version No. of Issues Cover Price e-Magazine No. of Issues Cover Price Total Price Discount You pay 12 1,200 12 1,200 2,400 55% 1,080 INR 24 2,400 INR 24 2,400 4,800 60% 1,920 36 3,600 36 3,600 7,200 65% 2,520 12 60 12 60 120 55% 54* USD 24 120 USD 24 120 240 60% 96* 36 180 36 180 360 65% 126* INTERVIEW BY SACHIN MANAWARIA TDB: India was once the leader in len- tils production but now Canada has taken over. How do you see it? Pradeep Ghorpade (PG): The primary reason for this is the absence of pulses in our Public Distribution System (PDS) and also their exclusion from the Food Security Act (FSA). Currently, most pulses in India are trading either at min- imum support price (MSP) or slightly above the MSP. This has led to farmers exploring the option of moving to other crops like paddy, wheat, cotton, soybean etc. Other factors that have affected pro- duction of lentils include low yield, frag- mented land holding, lack of modern technology and poor seed quality. All this has affected lentil production. of lentils crop across India? Also throw some light on the sowing patterns in Canada and Australia. PG: Kharif sowing is still in progress and will go on till the first week of Au- gust. Hence, it is difficult to say anything at present. As per statistics released by Canada, lentil seeding is on in 3.24 mil- lion acres – about 380,000 acres higher than previous year. No additional delivery charges apply to India-based subscribers. *Rates exclusive of airmail charges for all international subscribers. [Applicable annual additional charges: $80 for SAARC nations; $120 for other countries.] Rates valid during the issue month only. NOTE: All approved subscriptions include both Print and e-Magazine offers. No request for standalone Print or e-Magazine subscription(s) shall be entertained. TERMS & CONDITIONS 1. This is a limited period offer. 2. The Dollar Business and Vimbri Media Pvt. Ltd. will not be held responsible in case of any postal / courier delay in delivery of any issue of the magazine. 3. The Dollar Business and Vimbri Media Pvt. Ltd. will not be held responsible in case of any production delay that leads to late delivery of any issue to its subscriber(s). 4. If for any reason, a certain issue of The Dollar Business is not published, the subscription will automatically be extended by a month. 5. The Dollar Business and Vimbri Media Pvt. Ltd. reserve the right to terminate any subscription or accept or reject any request for subscription. 6. Disputes, if any, are subject to the exclusive jurisdiction of courts in Hyderabad only. 7. Any change in periodicity of The Dollar Business magazine may apply to existing subscribers. They will continue receiving the same number of issues they had originally subscribed to. They duration between issues may however stand duly altered. 8. Any change in the cover price of The Dollar Business magazine will not apply to existing subscribers. They will continue receiving the same number of issues they had originally subscribed to. 9. It is the sole responsibility of the subscriber(s) to report delay in delivery of any issue of the magazine to the subscription department of The Dollar Business within 14 days of the issue release date. 10. It is the sole responsibility of the subscriber(s) to report non-receipt of any issue of the magazine to the subscription department of The Dollar Business within 30 days of the issue release date. 11. Terms and conditions may be altered without notice to the subscribers. 12. For Delivery, Return and Refund Policies, and for more information on Subscriptions, please log on to www.thedollarbusiness.com TDB: Our domestic yield is well below the world average. What steps should be taken to increase productivity? PG: As mentioned earlier, we need to encourage farmers to take up lentils cultivation. As things stand today, there is no incentive for a farmer to improve the yield. Inclusion in PDS and FSA will then have to be supported with improved high yield seeds. Apart from that, lentil crop is prone to diseases like rust, wilt and root rot. These biotic stresses have been reportedly reducing the produc- tivity by 20-25%. The other important constraints are lower productivity in rice fallows, terminal stress and low biomass production. The government will also have to support the lentil farmers with low-cost financing. This will help them adopt better agri-techniques and mod- ern machinery to produce better quality and increased quantities of lentils. For subscription-related queries, please write to us at subscription@thedollarbusiness.com or call us on +91 40 66770765. We’d love to hear from you! You can also write to us at: The Dollar Business, Vimbri Media Pvt. Ltd., 5-2-198/4, Distillery Road, Ranigunj, Secunderabad, Telangana – 500 003, IN TDB: What steps should the govern- ment take to ensure that our depen- dence on imports is minimised? PG: The main step that the government should take to reduce our dependence on imports is include lentils in our PDS and bring it under the FSA. This will pro- vide a huge incentive to our farmers to cultivate lentils and other pulses. The in- clusion in PDS and FSA will ensure that the produce is procured by the govern- ment at appropriate rates and that trad- ing levels stay well above the MSP giving good returns to farmers. Subscription for 1 Year (12 issues) INR 1,080 / USD 54* 2 Year (24 issues) INR 1,920 / USD 96* SUBSCRIBE BY LOGGING ON TO WWW.THEDOLLARBUSINESS.COM AND PAYING ONLINE (MANDATORY FOR ALL INTERNATIONAL SUBSCRIBERS) OR FILL THE BELOW-MENTIONED PARTICULARS OF PAYMENT THROUGH CHEQUE / DD MODE 3 Year (36 issues) INR 2,520 / USD 126* SIMPLY ENCLOSE YOUR BUSINESS CARD OR FILL THE BELOW-MENTIONED FIELDS TO SUBSCRIBE Name: Address: BIOTIC STRESSES, LOW PRODUCTIVITY OF RICE FALLOWS AND LOW BIOMASS PRODUCTION ALSO CONTRIBUTE TO LOW PRODUCTIVITY OF LENTILS I am enclosing a Cheque / DD No:.................................. dated drawn on......................................... ......................................................................................... for INR1,080 / INR1,920 / favouring Vimbri Media Pvt. Ltd. payable at Hyderabad Add Rs.50 for non-Hyderabad cheques (not required for At Par cheques). Please write your name and address on the reverse of the cheque/DD. Do not send cash. Please send the filled form to: City: State: Pin code: Telephone no.(s): Email: Date of Birth (DD/MM/YYYY): Company Name: SUBSCRIPTION REQUESTS CAN BE PLACED BY LOGGING ON TO WWW.THEDOLLARBUSINESS.COM, FILLING-IN NECESSARY DETAILS IN THE APPLICATION FORM GIVEN AND MAKING PAYMENTS USING CREDIT CARDS/ DEBIT CARDS OR VIA NET BANKING INR2,520 The Dollar Business, Vimbri Media Pvt. Ltd., 5-2-198/4, Distillery Road, Ranigunj, Secunderabad, Telangana – 500 003, IN sachin@thedollarbusiness.com TDB: What is the current sowing status TO SUBSCRIBE ONLINE: www.thedollarbusiness.com 46 THE DOLLAR BUSINESS II AUGUST 2014
FOR THE ULTIMATE GAME CHANGER It’s unfortunate that an accounting exercise like the Union Budget gets massively disproportionate coverage while the Foreign Trade Policy – with a five times longer lifecycle – gets mostly ignored. So, with the countdown for the FTP having already begun and it having the potential to make or mar our prospects of ache din, we decided to talk to the real stakeholders – from CEOs to attorneys – to get a sense of what they want and expect from the new policy, which will help India achieve that elusive $500 billion/annum export figure as early as possible SERVICES Imbibing the idea that even services can be exported should not be that difficult, isn’t it? EXEMPTIONS & REMISSIONS If we just stop tinkering with drawbacks on an everyday basis, these schemes can be much more effective FOCUS & PROMOTION All we need to do is get focus back in our Focus Schemes and promote only what is relevant EPCG Although the scheme has succeeded in achieving its purpose, monitoring issues have taken the sheen off it EXPORT PROMOTION ZONES While the ones who have benefitted from government largesse continue to ask for more. Those left out feel let down DEEMED EXPORTS There’s no point just deeming them as exports. It’s about time we treat them as exports too 48 THE DOLLAR BUSINESS II AUGUST 2014 AUGUST 2014 II THE DOLLAR BUSINESS 49
COVER FEATURE FOREIGN TRADE POLICY: WHAT THE INDUSTRY EXPECTS COVER FEATURE FOREIGN TRADE POLICY: WHAT THE INDUSTRY EXPECTS The government has been incentivising the export of agri-commodities via the Vishesh Krishi Gram Udyog Yojana (VKGUY) Total sanction under ASIDE Scheme has risen... ...but actual release of funds under ASIDE has been questionable State wise allocation under ASIDE Exports are dominated by southern states 700 Andhra Pradesh Gujarat Harayana Karnataka Maharashtra Tamil Nadu West Bengal Assam Others 7% 600 12% 500 32% 400 4% 300 9% 200 100 6% 12% 0 6% FY03 FY04 FY05 FY06 FY07 FY08 FY09 FY10 FY11 FY12 Source: Ministry of Commerce; Breakup for FY2013 11% Source: Ministry of Commerce, GoI; figures in Rs. crore A in FY2012 sums up how that scheme and several similar schemes, have lost direction. For, the money allotted un- der ASIDE scheme in FY2013 to states like Bihar, Delhi, Arunachal Pradesh and J&K, and to UTs like Andaman & Nicobar, Chandigarh, Lakshadweep, Pondichery and a couple others was a grand zero. In fact, despite the desire for increased participation of States in Indian exports (which have managed to just about budge in the past couple of years), between FY2011 and FY2013, the actual release of funds to India’s 35 States and UTs under the ASIDE scheme has actually shrunk by 7.1%! Floated in 2002, the primary goal of the scheme is to “involve states/UTs in export effort by providing assistance to the State Govern- ments/Union Territory Administrations for creating appropriate infrastructure for development and growth of exports.” So, does a zero release of funds to ten of India’s constitutionally divided parts and in single-digit (crore) to nine more simple look at the breakup of the money put aside for the ASIDE – Assistance to States for Developing Export Infra- structure and Allied Activities – scheme – mean there’s no need for infrastructure development in these states? And despite complaints about delays in completion of projects and escalation of costs under the scheme, it is hard to imagine how in the past four years, release of funds have actually trailed the allocations – each year! Genuine intentions and trust in the scheme, perhaps would have pushed the centre to allocate more in the name of ASIDE. That was not reality. The Market Development Assistance (MDA) and Market Access Initiative (MAI) schemes too seem to have fall- en short of expectations. Under these schemes, the government provides monetary assistance to help exporters attend trade fairs/exhibitions/buyer-sell- er meets and also to export promotion councils, industry and trade associations and other such entities organise export promotion activities. However, industry insiders tell The Dollar Business that ei- ther these schemes are just on paper or the funds are grossly misused. Similarly, the government provides incentives under the Focus Market Scheme (FMS), when exports are made to certain specific countries. The trouble is, the total number of countries covered WITH 125 COUNTRIES INCLUDED UNDER THE FMS, THE SCHEME SEEMS TO HAVE COMPLETELY LOST FOCUS FOCUS & PROMOTION under the FMS has now reached 125 and does not include US and key European markets! Of the many reasons why the Focus Market Scheme (FMS) was constructed, one was definitely to encourage India’s exports. It wasn’t solely made as a so- cial service tool to delight LDCs (Least Developed Economies). So while you have encouragement of India’s exports to far flung and least known nations in Latin America through FMS, why is it that Brazil is the only name missing from Latin America – India’s biggest ex- port market in Latin America, and yet one that accounts for under 1.8% of its exports! This is proof that this scheme ignores countries that are in fact, In- dia’s main markets with high disposable TIME FOR MORE FOCUS, LESS PROMOTION Like any other business activity, ‘exports’ too needs hand-holding. And trying to provide a helping-hand to Indian exporters at every step is the Government of India, with a plethora of schemes – from providing assistance to states for infrastructure development to providing incentives for specific goods in specific markets. However, it seems there’s a lack of focus in many of these schemes, which is defeating the very purpose they were created for. With the new Foreign Trade Policy round the corner, it’s time the government picks up the scrutiny lens 50 THE DOLLAR BUSINESS II AUGUST 2014 AUGUST 2014 II THE DOLLAR BUSINESS 51
COVER FEATURE FOREIGN TRADE POLICY: WHAT THE INDUSTRY EXPECTS incomes and consumption patterns! Is that the right approach to any develop- ing nation’s foreign policy – one that has struggled in recent years to breach the 2% mark in contribution to global mer- chandise trade? The objective of FMS as laid down in the previous FPS was “to offset high freight cost and other exter- nalities to select international markets with a view to enhance India’s export competitiveness in these markets.” What is the methodology of choosing nations in this category? There may be larger for- eign policy reasons why certain names are included in this particular scheme, but is the very purpose of the scheme being served? Going by the fact that In- dia accounts for just 2.1% of the world’s merchandise trade (2013), our nation’s export competitiveness needs to be en- hanced in all countries; not just across LDCs. Additional duty credit scrip can be granted for exports to select markets (the 125 nations), but to encourage an overall growth of India’s exports base, a minimal value of duty credit should be given for all markets. All. Then there’s also the Served From In- dia Scheme (SFIS), that was intended to create a brand equity for Indian services. The objective of the scheme was to ac- celerate growth in the export of services to create a powerful and unique brand, instantly recognised and respected all over the world. As per the scheme, any service provider, with at least Rs.10 lakh worth of foreign earnings in a financial year, was eligible for duty credit scrip of 10% of total forex earnings that can be used in the following year. While in case of Star hotels, the duty credit was 5% of forex earnings, in case of standalone restaurants it was 20%. The duty credit was allowed to be used while importing any capital goods including spares, office equipment, professional equipment, of- fice furniture & consumables and even food items & alcoholic beverages. [Lat- er, via the notification dated January 18, 2011, the eligibility was brought down to just Rs.5 lakh for individual service pro- viders.] Under this scheme, services ex- porters get back a certain percentage of the value of their exports in the form of duty credit scrip. In 2013, when SFIS was still in its infancy and the basic objectives for floating it had barely been achieved, the government dropped a bomb while announcing the annual supplement to the FTP by changing the rules for cal- culating duty credit scrip entitlement. Post the supplement, a service provid- er is now entitled for 10% duty credit only on net forex earnings and not gross forex earnings, as was the case earlier. This came as a rude shock and ended up making SFIS just a forex earning scheme instead of a brand building exercise for the Indian services sector. For, if the idea is to build a unique, powerful, rec- ognisable and globally respected brand, as was envisaged in the FTP 2004-2009, just how many dollars one contributes to the economy can never be the criteria for incentivising service providers. This rationalisation will have a much bigger impact on smaller service providers be- cause the large players don’t have a huge expenditure as compared to their earn- ings. What really stops Indian service providers from fully benefitting from the scheme is the fact that the duty cred- Certain wooden furniture are also covered under the Vishesh Krishi Gram Udyog Yojana “PROVIDE DUTY CREDIT OF 5% FOR BIG AND IMPORTANT MARKETS LIKE US AND EU” B markets which earlier seemed out of bounds. However, I believe that instead of these two schemes we need to focus more on Market Linked Product Focus Scheme (MLFPS), which combines both the market and the product focus. I believe we cannot ignore the fact that US and EU are by far the largest consumers of apparels in the world and in these key markets our competitors have a much higher market share than us, thanks to greater incentives by their respective governments. Hence, a duty credit scrip must include these markets. In fact, AEPC has already recommended to the government to have an MLFPS where exporters are entitled to 5% duty credit scrip for the US, EU and Japan and 7% duty credit scheme for far off markets such as South America. The duty credit scrip should be left at 3% for all other markets. RAHUL MEHTA President, Clothing Manufacturers Association Of India oth the Focus Product Scheme (FPS) and the Focus Market Scheme (FMS) have definitely helped improve the export competitiveness of the Indian apparel indus- try and also, to some extent, broaden our export basket and allowed us to reach (CMAI) MAI and MDA allocation MDA allocation has remained roughly the same for the last five years 160 140 120 100 80 60 40 “REIMBURSE/SUBSIDISE INLAND FREIGHT UP TO THE PORT” 20 0 FY2008 FY2009 FY2010 FY2011 FY2012 FY2013 Market Access Initiative (MAI) Market Development Assistance (MDA) D turing which is a very labour incentive process – was reduced from 12.3% to 11.7% last year. We feel, it should be increased to at least 14% of the FOB value, without any value restriction because that is what the Chinese government provides to its exporters, who are our biggest competitors in global markets. We also feel the Focus Product Scheme has succeeded in providing the desired impetus to the product group covered under it and should be continued. What we would also like to see in the upcoming Foreign Trade Policy is some kind of announcement that would give a level playing field to companies like us and make our exports competitive. One way of doing this is to reimburse/subsidise inland freight up to the port. For example, at present, the inland freight Ex-Ludhiana to Nhava Sheva in Mumbai is more than the ocean freight Ex-Mumbai to Europe. It becomes very difficult to compete at a global level if we spend so much to transport our products within our country. We would also like to see the announcement of a scheme, whereby an exporter is insulated from exchange rate fluctuations. Moreover, to facilitate promotion of Indian products abroad, the government should sponsor the participation of Indian exporters in more fairs and exhibitions and increasing the ceiling for eligibility. uty drawbacks and incentives that are provided by the Government of India to ex- porters are primarily intended for labour intensive industries since unemployment is a major issue in our country. Despite this, duty drawback on bicycles – manufac- Source: Ministry of Commerce; figures in Rs. crore G. D. KAPOOR ED (Sales and Marketing), Hero Cycles “INCREASE INCENTIVES UNDER VKGUY TO AT LEAST 12%” I increased by a few percentage points. Our Chinese counterparts get massive incentives from their government and hence, it has become very difficult for us to compete with them. When it comes to honey in particular (it being a product with very volatile prices), companies like ours face a lot of problems and our margins are shrinking by the day. In my opinion, incentives under VKUY should be increased to at least 12% and some incentive should also be provided in terms of income tax. Since it’s an incentive provided by the government it should not be taxed at all. ncentives provided by the government under the Vishesh Krishi and Gram Udyog Yo- jana (VKGUY) are primarily meant for offsetting high transportation costs. But since freight costs have increased significantly in recent years, I feel the incentives should be MANPREET SINGH BHASIN Managing Director, Pioneer Food & Agro Industries 52 THE DOLLAR BUSINESS II AUGUST 2014 AUGUST 2014 II THE DOLLAR BUSINESS 53
COVER FEATURE FOREIGN TRADE POLICY: WHAT THE INDUSTRY EXPECTS it scrip is non-transferable. This makes it useless to a lot of service providers who have no need for imports in the near future. Non-transferable duty cred- it doesn’t give a level playing field to all service providers and definitely does not help build the ‘Served From India’ brand. On the part of the government, if the aim is really to serve India’s greatness to the world by promoting its services sector, the government has to be liberal and provide tangible benefits to exporters. Being a country, in which a large sec- tion of the population still depends on agriculture or allied sectors, the govern- ment has also floated the Vishesh Krishi Gram Udyog Yojana (VKGUY), under which duty credit scrip is provided in case of exports of specific agri-prod- ucts – from tea to furniture and bam- boo to homeopathic medicine. While the main aim of the scheme is to offset high transportation costs for exporters of these items, the incentive appears to be way too small, particularly in recent years when freight costs are continuously heading north. However, with incentives worth Rs.1,697 crore provided under it just in the first eight months of FY2013, this is one scheme that is no doubt doing a reasonable job in promoting exports of a sector, which is often overlooked. If only we could do something more. Focus & promotion measures FPS is the most popular scheme in this category 3,500 140,000 3,000 120,000 2,500 100,000 “PAPERWORK INVOLVED IN CLEARING GOODS FOR EXPORTS & IMPORTS SHOULD BE SIMPLIFIED” 2,000 80,000 1,500 60,000 1,000 40,000 500 20,000 0 0 FMS FPS VKGUY SHIS E ductivity in our country, the latter makes both production and exports difficult. The incentives currently available on export of textiles from India are being questioned in WTO on the ground that according to its Agreement on Subsidies and Countervailing Measures (ASCM), a country is not entitled to incentivise exports of a product in which it has reached 3.25% of global trade for two consecutive years. ASCM provides for a period of eight years in the case of a developing country like India for gradually phasing out all export subsidies on such a product. In textiles and clothing, which are together considered as one product under ASCM, India had exceeded 3.25% of world trade in 2009 and 2010 and this would mean that all our export incentives on textile products would have to be phased out by 2018. Among the major export linked incentives that the textiles industry gets now are the benefits of Focus Schemes, EPCG Scheme, Market Development Assistance, Interest Subvention on Export Credit and the 3% Import En- titlement for embellishments that the garment exporters get. Whether any of these can claim exemption under ASCM is a matter of negotiation. Research activities and some of the region specific incentives may get exemption under ASCM. We need to address this issue with imaginative solutions and some of them may have to go beyond the FTP. The first priority should be to operate the relatively more attractive schemes more forcefully and for the maximum possible period. If interest subvention is extended to working capital taken by all textile units rather than by exporters alone, it should not come within the purview of ASCM and the additional expenditure of gov- ernment will be going for a productive cause. Prohibited export subsidies can also be phased out relatively less painfully. Transaction costs are our own making and the gov- ernment alone can save the industry from them. FTP can address some of them. For ex- ample, the paperwork and procedures involved in clearing goods for exports and imports can be simplified further. HS lines at eight digit level can be provided for technical textiles. Refusal of government to share the quick estimates of DGCI&S on export data with the exporting community is an entirely avoidable transparency issue. Similarly, mandatory registration of contracts for export of cotton has been stipulated for statistical monitoring, but the data is not shared with the industry or the market, though similar data for cotton yarn is shared. A broader issue is the border agonies that our goods suffer for entering every State in their journey within the country. At times, exporting takes less time and money than internal transport! D. K. NAIR xport incentives and transaction costs are the two most important areas that need attention, particularly when it comes to the textile sector. For, while the former compensates for the disadvantages of infrastructural infirmities and low labour pro- Duty Credit (left axis) FOB / EO (right axis) Secretary General, Confederation of Indian Textile Industry (CITI) Source: Ministry of Commerce, GoI; figures for first 8 months of FY2013;in Rs. crore “TEXTILE SECTOR SHOULD GET HIGHEST INCENTIVES SINCE IT CREATES MAXIMUM JOBS” T tivity; to earn more foreign exchange and to encourage growth of Indian exports. Textile manufacturing and exports garner highest points on every score, over all other exports from India. Textiles need higher freight compensation as a percentage of FOB value given its lower per container value. This segment creates between 5 and 20 times more jobs per rupee of incentives received compared to engineering products, furniture or assembled electronic items. It has almost zero percentage import intensity in its exports. The export of textiles is perfectly elastic, even 2% or 3% price reduction can help gar- ner substantial additional exports. Most textile exports are profitable only with incentives as the industry in general operates with one of the lowest profits on turnover. Highly prof- itable companies/sectors will not increase exports with incentives as they would any way export to their potential. Given the very high targets that textile exports have achieved, they should get the highest incentives. The policy needs to be implemented in a transpar- ent manner giving true weightage to all stated objectives. Textile exports should also get additional budgetary allocation to help create at least 25 lakh new jobs and $10 billion additional exports each year with the lowest incentive outflow per job created or per additional dollar earned. Based on the above logic, Texpro- cil has identified the products for incentives and also the markets where support is need- ed on the basis of potential of the market, India’s present position and the advantages enjoyed by the countries that have a deeper penetration. MANIKAM RAMASWAMI Chairman, Texprocil he government has focus schemes to incentivise exports based on the following objectives: To help exporters overcome freight costs to distant markets/not so well developed markets; to encourage creation of jobs through increased export ac- 54 THE DOLLAR BUSINESS II AUGUST 2014 AUGUST 2014 II THE DOLLAR BUSINESS 55
COVER FEATURE FOREIGN TRADE POLICY: WHAT THE INDUSTRY EXPECTS IT’S THE BUSINESS END, STATISTICALLY When it comes to Indian exporters, a bulk of the exemptions, incentives and remissions they avail are covered under the ambit of duty exemption and remission schemes. Although they have been immensely successful in helping the growth of Indian exports, they have, without a doubt, their own issues which needs to addressed on an urgent basis D of inputs required for producing goods that are exported. Two, duty remission schemes that enable post-export replen- ishment/remission of duty on inputs used in an export product. The first cat- egory can be further broken down into two – Advance Authorisation that saw a duty credit of Rs.1,28,146 crore just in the first eight months of FY2013, thus making it, by a country mile, the most popular and Duty Free Import Authori- sation (DFIA). In the second category, after the death of the once very popular but complicated Duty Entitlement Pass- book Scheme in FY2012, we have the Duty Drawback (DBK) scheme which provides duty drawbacks of specified percentages to various exported goods. thorisation availed, an exporter is giv- THE MORE THE BETTER The post-export Duty Drawback Scheme provides drawbacks after goods are ex- ported and hence, although not as pre- ferred as pre-export schemes, make ex- porters more accountable and are very simple to monitor. But what has been a cause of concern for various industries is the fact that drawback rates are tinkered with almost every year, thereby making decision making difficult for several busi- nesses. Let’s take the case of motorcycles. The duty drawback on motorcycles has consistently come down in the last three years – from 5.5% in FY2012 to 2% in FY2013 and just 1.7% in FY2014. What this has meant for India’s top motorcycle exporter, Bajaj Auto, is that its export in- centives have fallen by close Rs.220 crore in the same period, from Rs.564.24 crore in FY2012 to Rs.335.94 crore in FY2014, despite a 25% jump in exports! And it’s anybody’s guess what such kind of big policy-induced fluctuations can do to smaller companies, without the financial muscle of a Bajaj Auto. EXEMPTIONS & REMISSIONS Advance Authorisation scheme is by far the most utilised scheme in India, with Rs.128,146 crore worth of duty credit availed under it in just the first eight months of FY2014 uty exemption and remis- sion schemes can be broad- ly categorised under two heads. One, duty exemption schemes that enable duty free import The duty drawback can vary from 0% as is the case with most dairy products to as high as 11.7% as is the case with bicycles. en an export obligation that has to be achieved within a specified timeframe. “ALLOW IMPORT OF GROUNDNUT FOR EXPORT BY WAY OF SELF- DECLARED AUTHORISATION” Duty exemption and remission schemes Advance Authorisation scheme is the most popular in this category NUMERO UNO The reason the Advance Authorisation scheme is extremely popular with the exporting community is the fact that it leads to a lot of savings in terms of work- ing capital needs. For, not having to pay duty when an exporter is importing in- put components that will be used in the final product is always more welcome than the same duty getting remitted after the product is exported. The scheme is also popular because supply of goods to SEZs are also included under it. Advance Authorisation necessitates exports with a minimum value addition of 15% (20% in case of DFIA) to ensure that duty free imports are not exported away in ‘as it is’ form. For every penny of Advance Au- I cessed groundnuts. Advance Authorisation is issued, where SION are not fixed, based on self-declaration, with an undertaking that final adjustment as per Adhoc norms or norms fixed by NC (Norms Committee). However, import of oilseeds under Chapter 12 is excluded from the scheme as mentioned in Para 4.7 of Hand Book of Procedures. Since the SION are not fixed for groundnut, the exporters are not able to import based on Self-Declared Authorisation. Thus, import of groundnut under Self-Declared Norms should be allowed under the Advance Authorisation Scheme. Similarly, exports of sesame seed were earlier given benefits under VKGUY, which were stopped since introduction of Annual Supplement on Foreign Trade policy on the 5th of June 2012. Our competing origins from African countries enjoy duty free access to the sesame seed world market. In order to provide a level-playing field and effectively compete in world markets, it is necessary to support sesame seed exports by way of restoring the VKGUY benefits. Worldwide, there is a huge potential for blanched peanuts. India has not been able to focus on export of this value added product due to huge incentives offered by our competitors. For example, China encourages its exporters with an export incentive of 15% on blanched peanuts. As a result, China commands a major share in the world blanched peanut market. Argentina, on the other hand, being a net exporter of peanuts, has benefited by offering their produce at lower prices. There is a big international market for blanched peanuts, which has been steadily growing. This product also has over 30% value addition in comparison to raw peanuts, which means it will fetch higher export re- alisation for the same quantity. At present only 5% VKGUY benefit is available on export of blanched peanuts, which does not provide a level playing field to Indian exporters. In order to support this value added segment of peanut exports, we want the government to consider giving additional incentives on export of value added blanched peanuts. On the other hand, the export of edible oils is permitted in branded consumer packs of up to 5 kg, subject to a minimum export price (MEP) of $1,100 /tonne. The mandatory requirement of maximum 5 kg retail packing size for export, increases the cost both for exporters and importers. The importers largely prefer packing in bulk. This clause is a big impediment in increasing exports of oil, and should be done away with. KISHORE TANNA Chairman, Indian Oilseed and Produce Export Promotion Council (IOPEPC) n order to export value-added processed groundnuts, many-a-time exporters are required to import groundnuts. Since the Standard Input Output Norms (SION) for groundnut are not fixed, imports is not allowed for the purpose of re-export of pro- 140,000 180,000 160,000 140,000 120,000 100,000 80,000 60,000 40,000 20,000 0 120,000 100,000 80,000 60,000 40,000 20,000 0 Advance Authorisation (left axis) Duty Drawback - Post Export (left axis) Duty Free Import Authorisation (left axis) FOB / EO (right axis) Source: Ministry of Commerce, GoI; figures for first eight months of FY2013; (in Rs. crore) RESCIND NOTIFICATION NO.31, DATED AUGUST 1, 2013. T respect of every Advance Authorisation / DFIA”. This notification directly contradicts para 4.2.6 of FTP, which deals with transferability. On one hand, para 4.2.6 allows transfer- ability of the inputs imported against the authorisation, whereas notification 31 disallows and restricts an exporter to import and use the products in the export product only. So the whole purpose of allowing transferability of DFIA is defeated. he effect of this notification is that “inputs actually used in manufacture of the ex- port product should only be imported under the authorisation. Similarly inputs ac- tually imported must be used in the export product. This has to be established in GURMEET SINGH CEO, Bonn Food Industries 56 THE DOLLAR BUSINESS II AUGUST 2014 AUGUST 2014 II THE DOLLAR BUSINESS 57
COVER FEATURE FOREIGN TRADE POLICY: WHAT THE INDUSTRY EXPECTS “NEED TO HAVE MORE CLARITY ON AVERAGE EXPORT OBLIGATION” EPCG SCHEME E average export obligation, exchange rate, redemption, consolidation etc. I would also like to see more clarity when it comes to the disconnect between EPCG scheme and Status Holder Incentive Scheme (SHIS). As per the FTP, if in one particular financial year, the zero percent EPCG scheme is availed, SHIS cannot be obtained. The intention seems to ensure that on same exports, both the pre-export EPCG and post-export SHIS should not be claimed. However, customs notifications and interpretations, as of now, have not taken a view as to why SHIS cannot be obtained, if EPCG is also obtained. This should be clarified lucidly and the ambiguity done away with. Although there is one school of thought that believes incentives should only be provid- ed post-exports and not pre-exports, there already are several schemes like SHIS and SFIS that belong to the former category and hence, I strongly believe that EPCG should be retained as a pre-export scheme. POPULAR, YET COMPLICATED Ever since the EPCG scheme was launched to increase the export of finished goods by making the import of capital goods cheaper, it has seen several rounds of tinkering. There’s also a growing feeling that pre-export schemes like EPCG are difficult to monitor and prone to manipulation. Is it time to do away with this popular, complicated scheme? Or will the new FTP make matters simpler? PCG is a good pre-export mechanism and should be retained in the upcoming For- eign Trade Policy (FTP). However, there are several areas in EPCG which need to be streamlined. For example, there needs to be much more clarity in aspects like B. SRIRAM Partner, Tax and Regulatory Services, Ernst &Young LLP Duty exemption vs. export obligation Exemption availed under EPCG is in a downtrend 25,000 160,000 140,000 7.9 20,000 120,000 8.1 6.1 100,000 15,000 7.6 8.3 80,000 10,000 60,000 40,000 5,000 20,000 0 0 FY2009 FY2010 FY2011 FY2012 FY2013 Duty Credit (left axis) EO (right axis) *Avg. EO for every rupee of duty credit Source: Ministry of Commerce; figures in Rs. crore EPCG scheme provides cheaper access to superior technology to Indian manufacturers but given its very nature, is difficult to monitor I hold an exporter through the process of exporting? What if even after the neces- sary hand-holding, a prospective export- er fails to export what it had promised it will manage to do? On the other hand, if we lack the technology to compete in the global market in the first place, what’s the t’s an egg-chicken classic. No doubt a government should do all it can to encourage exports. But should it incentivise an exporter only after it has managed to export or should it hand- to be lower than the cost of working cap- ital for many firms, leading to numerous cases of intentional defaults. Secondly, af- ter EOs were found to be too ambitious, the government has been relaxing them for companies in specific sectors/geogra- phies etc. In fact, this has actually reached a stage where the actual EO comes down to just 25% of the normal EO, thereby al- most defeating the very objective of the scheme, i.e., promote exports. Further, in last year’s annual sup- use of providing incentives after exports since anyway they are not going to hap- pen because of our inferiority? These are some of the existential is- sues that always seem to surround one of India’s flagship export promotion schemes – Export Promotion Capital Goods (EPCG) scheme. Simply put, it is a scheme where the government is ready to waive off customs duty for an im- porter of capital goods on the condition that he/she will meet a government set plement to the FTP, a new post-export EPCG scheme was introduced that al- lows for getting the customs duty back in terms of duty credit scrip by meeting just 85% of the normal EO, provided full customs duty was paid at the time of importing capital goods. While one cannot really find any fault in this new scheme when seen on a standalone ba- sis, it definitely blurs the difference be- tween a pre-export and post-export scheme, thereby putting a big question ‘export obligation’ (EO) within a pre-set timeframe. While this sounds more than fair and logical, implementation on the ground is an altogether different story. Firstly, it’s one thing availing the bene- fits while importing capital goods, but an altogether different thing meeting the EO within the stipulated time frame. While the government has enough penal mea- sures in place and one has to pay 18% in- terest on the duty saved in case one fails to meet the EO, the rate has been found mark over the government’s strategy for such schemes. Further, there is still lot of ambiguity when it comes to arriving at normal EO – should it be calculated as per the 3% or zero duty EPCG scheme or whether the exporter has the option to ask for normal EO calculation as per one of those schemes remains unclear to many. Lastly, just how difficult monitor- ing EPCG is can be judged from the fact that as per the scheme, the EO of a unit is over and above the average exports of 58 THE DOLLAR BUSINESS II AUGUST 2014 AUGUST 2014 II THE DOLLAR BUSINESS 59
COVER FEATURE FOREIGN TRADE POLICY: WHAT THE INDUSTRY EXPECTS F excess of $300 billion. With an inten- tion to reduce the nightmares, several policies have been announced over the years by successive governments to en- courage exports. This includes forma- tion of Electronic Hardware Technology Parks (EHTPs), Export Oriented Units (EOUs), Software Technology Parks (STPs), Biotechnology Parks (BTPs) etc. And over the years they have been showered with sops – from income tax exemption to duty free import of goods, to benefits of deemed exports – that have, sometimes, been extended, taken back, rationalised and at times, negated by flawed decisions. But as with many things in India, every time we do some- thing new, we completely forget the re- percussions on those that already exist. EXPORT ZONES that particular unit in the three years that precede the year in which EPCG scheme was availed – if this is not a monitoring nightmare, nothing is! However, despite many such major is- sues, EPCG is one of the most popular schemes among Indian exporters. For, or a country still smarting from the forex crisis of the early 90s, nothing is more precious than those greenbacks. This, even though our current reserves are well in not only does it reduce capital outlay thereby making foray into a particular business that much easier, but it also makes Indian exporters that much more competitive in the global arena by giving easier access to the best of technologies. Even the critics of EPCG concede that it has indeed played an important role in increasing India’s exports, particularly in recent years. So, all that needs to be done now is to streamline the processes involved, simplify monitoring and not tinker with the EO beyond what is ex- tremely important. (EOUS, STPS, ETC) SPECIAL CARE, SPECIAL ZONES “EPCG IS A GREAT MECHANISM AND SHOULD BE CONTINUED” If one has to pick just one industry that has truly transformed India and the perception about India in the western world, it has to be the Information Technology. From providing well-paying jobs to millions, to enhancing India’s brand equity – the IT sector has been a game changer. But with increasing clamour from within the IT industry and other sectors for the government to continue, increase and extend sops, it’s time to draw a line. The question is where? W will be applicable not only to importers who would be exporting goods in the future, but also to those importers catering to the domestic market. This would defeat the primary motive of EPCG, which is to enable higher exports. Secondly, it would be a death knell to domestic capital goods manufacturers because the market is very competitive and reduction in customs duty would give an unfair edge to imported goods. Moreover, cus- toms duty cut for capital goods would also have to be extended to components and spare parts of capital goods, else it would lead to inverted duty structure, which is contrary to the stated policy of the Indian government. There’s also a technical issue. The reduction of duty is a prerogative of the Ministry of Finance and hence cannot be reduced by the Ministry of Commerce and Industry, which announces the FTP. In fact, many a time, even after certain benefits are announced under the FTP, the effects are taken back by way of notifications under the Customs Act, which are issued by the Ministry of Finance. Even though there have been several instances of EPCG being misused, it is still the most effective mechanism to support exporters in relation to their need for capital goods. What we need to work on is make the process of administration more stringent. hile reducing customs duty on the import of capital goods is theoretically a much better mechanism to access superior technology and boost exports, such a step would lead to several complications. Firstly, the reduced duties HARSH SHAH Associate Partner, Economic Laws Practice “INDUSTRY NEEDS TO EXPLORE THE NEW POST-EXPORT EPCG” Southern states have lapped up the concept of Software Technology Parks, with Karnataka leading the way T ability of exports or foreign exchange earned towards discharge of export obligation or compliance, EPCG continues to be a very popular scheme amongst exporters. India’s Foreign Trade Policy mandates extending duty/tax benefits on goods, including capital goods, which are exported. To that end, EPCG meets the purpose as it extends complete exemption from customs duty. Since the FTP allows duty/tax optimisation by using the same exports against more than one scheme, it’s only fair that we continue with EPCG. While I agree it is much simple to monitor a post-export benefit scheme as compared to a pre-export benefit scheme like EPCG, one has to bear in mind that not all exporters are inclined to go for post-export benefits as they may prefer upfront exemption rather than a subsequent refund or scrip. At the same time, even EPCG has a post-export variant, which has not been used much to the best of my knowledge. I would also like to add that post-export schemes are attractive generally for their transferability feature. But, even they have issues. o the best of my knowledge and awareness, there has not been any serious mis- use of EPCG scheme. Although there have been instances of exporters struggling to meet export obligations (EOs) and some issues in the past about the accept- STP units and exports The number of units in STPs has been falling consistently for the last five years State wise exports via STPI units Exports are dominated by southern states RAHUL SHUKLA Technical Director, 300,000 9,000 11% KPMG 14% 8,000 250,000 7,000 11% 6% 200,000 6,000 5,000 150,000 4,000 20% 100,000 3,000 2,000 38% 50,000 1,000 0 0 FY02 FY03 FY04 FY05 FY06 FY7 FY8 FY9 FY10 FY11 FY12 FY13 Andhra Pradesh Maharashtra Haryana Tamil Nadu Karnataka Rest Operating Units (left axis) Exporting Units (left axis) Total Exports (right axis) Source: STPI; export figures in Rs. crore Source: STPI; breakup for FY2013 60 THE DOLLAR BUSINESS II AUGUST 2014 AUGUST 2014 II THE DOLLAR BUSINESS 61
COVER FEATURE FOREIGN TRADE POLICY: WHAT THE INDUSTRY EXPECTS FUTURE IMPERFECT For years, EOUs were the darlings of the government. With EOUs being show- ered with all kinds of sops, and they on their part doing a phenomenal job, none had a reason to complain. All that was needed for one to continue as an EOU was to be a net foreign exchange earn- er within five years from the date of commencement. Then came the crisis of the 1990s and the need was felt to do more. And more we did. But, over the last few years, it seems, we have com- pletely forgotten the role that EOUs have played in the past and can play in the future. For the uninitiated, EOUs can be much more diversified than other export oriented centers and can operate in any sector – from agriculture to horticul- ture. Secondly, it is much cheaper to set up business in an EOU as compared to operating out of something like a STP. And lastly, EOUs lead to a more equita- ble growth of the economy unlike oth- er export centers, which generally lead to concentration of income and wealth only in certain pockets. But with govern- ment deciding to take back income tax exemption that EOUs enjoyed for years, a big question mark has been put on the future of EOUs. This can also be seen in their export performance, which collapsed from a high of Rs.1,76,923 crore in FY2009 to just Rs.79,343 crore in FY2012. Reason: Government decided to go full hog with Special Economic Zones (SEZs), exports from which soared over 350% in the “BTPs SHOULD GET THE BENEFITS THAT STPs ENJOYED FOR YEARS” I tax concessions/waivers, whereas STPs enjoyed even corporate tax waiver for 90% of their income in the first decade plus two years of their existence. Even customs duty is zero on capital goods imports for STPs, whereas for BTPs the benefits are related to the stature of the Export House for drawing duty drawbacks only. This, despite the fact that biotechnology, as a sector, has tremendous growth potential. Biotechnology industry is highly R&D centric, where successes and failures go hand in hand. As such, the National Biotechnology Policy of the Department of Biotechnology advocates that biotechnology be recognised as a priority sector, which would facilitate bank lending at reduced interest rates. It also calls for tax holidays and duty exemptions for the sector. I hope there’s some kind of breakthrough on these fronts in the new FTP. India’s Foreign Trade Policy (FTP) helped STPs take off successfully and compete at the global level. Not only did they enjoy corporate tax holidays but a plethora of other benefits. No wonder, the Indian IT industry is globally competitive and sustainable. BTPs badly need an impetus similar to what the government provided to STPs to help them achieve their true potential. f we, as a country, want to replicate the success of Software Technology Parks (STPs) in Biotechnology Parks (BTPs), we have to offer BTPs the same sops that we offered STPs for over a decade. It’s unfortunate that BTPs have not been provided with any HARITA VASIREDDI Managing Director, Vimta Labs Bagmane Tech Park in Bangalore is a software technological park equipped with all modern facilities and is surrounded by a lake near the entrance smaller towns and established behe- moths (those which have enjoyed var- ious sops over many years) does not at all seem logical. There’s also the issue that several other sectors could never, due to varied reasons, enjoy the benefits that the IT sector enjoyed for years and are now feeling let down. The main sec- tor with such grievances is biotechnolo- gy, which is highly dependent on R&D, prone to failures and badly needs all the assistance it can get. HIGH HOPES As we keenly await the new FTP, the question in the mind of all stakeholders is if the government will do something for reviving EOUs, STPs and other such focussed export zones. Will it introduce an entirely new policy to turbocharge In- dia’s exports? And, of course, if Indian IT will be incentivised to start a second rev- olution. The Union Budget was a disap- pointing appetiser. Can the main course bring back the smiles? same period. In fact, despite certain sec- tions of the industry calling for the gov- ernment to revive EOUs, there is a sink- ing feeling that the latter wants EOUs to die a natural death. One can just hope and pray that the obituary is not a policy announcement away. SURVIVING SANS SOPS While Software Technology Parks (STPs) have played a pivotal role in making In- dian IT what it is today, non-extension of IT exemption after FY2011 has seen a very dangerous trend. The number of units operating in STPs has collapsed by almost 50% in the last five years. While the government might argue that despite this exports out of STP units are continu- ing to rise, the fact remains that the rate of growth is falling like a stone and new, small, innovative firms are finding it very difficult to continue. There’s no doubt that sops can’t be provided to a sector forever but giving the same treatment to new entrants in “WITHOUT TAX EXEMPTIONS, STPs ARE NOT AT ALL ATTRACTIVE” S spite strong pleas made by STP based units, the government has chosen not to extend them, STP based units are now paying income tax even on profits earned from exports. This has resulted in a large number of firms moving away from STPs, which can be seen from the fact that from a high of 8,455 units based in STPs in FY2009, only 4,534 units were still around as of FY2013. Without tax exemptions, STPs are not at all attractive because of physical and procedural hassles in running operations. While the extension of tax holidays for STP based units can be debated for those based in large cities, they should be, without any delay, extended at least for those based in tier II and tier III cities. This will help reduce the pressure on urbanisation and will also lead to the growth of tier II and tier III cities. If we can develop our smaller cities and also incentivise companies who move into these cities, we will start seeing jobs moving towards people as opposed to people moving towards jobs. Moreover, with the advent of special economic zones (SEZs), which provide income tax benefits, many companies have preferred to move on to them instead of renewing existing STP licences. I expect the new Foreign Trade Policy to also address some of the key challenges in SEZs. Minimum Alternate Tax (MAT) should be removed from SEZs as was originally envisaged and committed by the government. There should also be more clarity when it comes to other procedural challenges like service tax. oftware Technology Parks (STP) were extremely attractive until FY2011 as all prof- its made by STP based units were exempt from Income Tax under section 10A of the Income Tax Act. The tax benefits have expired since March 2011 and since de- B. V. R. M. REDDY Executive Chairman, Cyient (formerly Infotech Enterprises) Growth of exports by EHTP units Exports from Electronics Hardware Technology Parks jumped over 50% in FY2013 Exports from EOUs and SEZs After the introduction of SEZs, EOUs are dying a slow death 70 18,000 60 16,000 400,000 350,000 300,000 250,000 200,000 150,000 100,000 50,000 50 14,000 12,000 40 10,000 30 8,000 20 6,000 10 4,000 0 2,000 -10 0 0 FY02 FY03 FY04 FY05 FY06 FY7 FY8 FY9 FY10 FY11 FY12 FY13 FY8 FY9 FY10 FY11 FY12 EOUs SEZs Total Exports (Rs. crore; left axis) Growth Rate (%, right axis) Source: Ministry of Commerce, GoI; figures in Rs. crore Source: STPI; export value 62 THE DOLLAR BUSINESS II AUGUST 2014 AUGUST 2014 II THE DOLLAR BUSINESS 63
COVER FEATURE FOREIGN TRADE POLICY – WHAT THE INDUSTRY WANTS “DGFT SHOULD TRY AND RESOLVE TRANSMISSION ISSUES ” SERVICES A automation in recent years, there’s a lot of paperwork involved in DGFT’s affairs. The documentation process at DGFT is still very cumbersome and can weigh down even the most tenacious. There’re also several transmission issues at DGFT that need to be taken care of if the real fruits of automation are to be realised. There’s also the issue of Special Economic Zones (SEZs) that the government should really come clear about. SEZs were dealt a death blow and the very purpose of having them was defeated when the UPA government introduced the Minimum Alternate Tax (MAT). Not only did it erode the confidence of international investors but also put serious question marks over their future. The upcoming Foreign Trade Policy (FTP) should also have a clear vision about Free Trade & Warehousing Zones (FTWZs). While SEZ units have a reason to feel aggrieved due to the introduction of MAT, the fact is that they are coming up, has actually been a curse for EOUs. EOUs are far better for the larger economy than SEZs. Firstly, EOUs can come up anywhere, but to rent a similar space in a SEZ is an extremely costly affair. Secondly, EOUs lead to more equita- ble growth while SEZs are favourable to only those with deep pockets. The government should also come up with measures to simplify the process of tax refunds, particularly for the Services sector. I also feel that we should limit the use of pre-export incentives and try and push only post-export incentives. For, not only is moni- toring pre-export incentives very difficult but they are also prone to misuse. I am sure, the Modi government will announce an FTP that is pro-business and will help our exporting community scale new highs. EXPORT SERVICES, NOT TAXES If India is considered a serious player in the export of something, without a doubt it is Services. But although we are ranked 6th in the world in Services exports, our exports in CY2013 were less than a quarter of that of the top exporter – US. Add to this the fact that even to achieve this very generous incentives were provided for over a decade to the main component within Services – Information Technology. But what about others? The government needs to focus on other services as well if it really wants India to become a true Services powerhouse lthough the Directorate General of Foreign Trade’s (DGFT) e-BRC project won the 2013 eASIA Award at Ho Chi Minh City in Vietnam, Indian Services export- ers have enough reasons to feel not too enthused by it! Firstly, despite a lot of KAMAL JAIN Director, Cargomen Logistics The Indian outsourcing industry, which was initially dominated by voice process outsourcing, has now expanded to legal, medical, financial services and several other S it. The Rs.12.36 worth of tax is collected by the service provider and paid to the government. When it comes to exports, this 12.36% tax is exempted. But there is a catch. The tax has to be first paid to the government; the service provider has to then prove to the government that the service was actually exported and only then is it refunded. While even this sounds fairly doable, trouble arises in the definition of ‘exports’ – something that has seen a lot of changes over the years. Until February 2003, Service Tax was exempt on services for which consider- ation was received in foreign currency. A couple of months later, the CBEC issued a circular that Service Tax exemption is ‘destination based.’ Since this led to a lot of hue and cry due to lack of clarification, sectors ervices account for over 50% of the Indian economy and is taxed at 12.36%. So, if a service provider offers a service worth Rs.100, the end-user ends up paying Rs.112.36 for the earlier law was re-introduced as an interim measure in November 2003 and was continued till FY2005. Since then, laws that define ‘what is a service export’ have gone through several modifications and have been one of the primary areas of tax disputes. The information technology (IT) in- dustry in India benefitted from income tax exemptions for over a decade. This not only helped it earn a name for itself across the world, but also helped India maintain a slight Services trade surplus. But other Services haven’t at all benefited from such government largesse and have a reason to feel let down. Even the ‘Services only’ incentive scheme – Served From India Scheme (SFIS) – has more than its share of issues. Even though it’s a post-export scheme and the benefits arising out if it are avail- able only after the export process is over (that too without any hand-holding from the government), the duty credit scrip A lot of medical services like blood tests, X-ray tests are now outsourced to India is not transferable. This means in case a Service exporter has no need for im- ports, he/she doesn’t benefit at all from SFIS! Making it transferable will certain- ly help exporters of services like educa- tion, healthcare, consultancy and real estate that do not import much. When it comes to merchandise ex- ports, a lot of the inputs and capital 64 THE DOLLAR BUSINESS II AUGUST 2014 AUGUST 2014 II THE DOLLAR BUSINESS 65
COVER FEATURE FOREIGN TRADE POLICY – WHAT THE INDUSTRY WANTS About us goods are imported and that too duty free – thanks to schemes like Advance Authorisation and EPCG. But when it comes to Services, most of the inputs are procured domestically. Despite this, the Services sector isn’t provided with enough incentives and as discussed ear- lier, even getting service tax refunds for exports is a very cumbersome process. Another issue that a lot of industry players feel should be addressed is that of Minimum Alternate Tax (MAT) in SEZs. The irony of MAT is that not only did it erode foreign investor confidence in India in a massive way, it actually acts as a disincentive for domestic companies based out of SEZs. For example, while MAT doesn’t really matter to a Facebook because it can, anyway, claim global country credit back in US, an Infy or TCS based out of the same SEZ, has not such options. So, one area where all eyes will The vision behind ‘The Dollar Business’ is to become the most desired destination of information on foreign trade in the country! Description The journey of The Dollar Business has wonderfully begun. It belongs to the house of Vimbri Media Pvt. Ltd., a media company headquartered in Hyderabad. Indian hospitality is slowly, but surely, emerging as a major exporting sector and could benefit from the transferability of duty credit scrip under SFIS The Dollar Business is an India-based magazine for India-based exporters and importers – and the so-called, multinational giants – that believe in the magic of trade beyond borders. There are many business magazines in the country that claim to be ‘essential’ reads. They have many-a-claim to fame – usually without much reason or proof, like being number one in India across many dimensions. How uninteresting. The Dollar Business doesn’t claim to be number one. It’s the only one in India. And it doesn’t know many dimensions. Just one – global trade! be fixed at the time of the announcement of the FTP, is the government’s treatment of MAT and the overall strategy for SEZs and units based in them. India, as a nation, has a rich history of exemplary hospitality. Still services ex- ports from India is just about 50% of the country’s merchandise exports. So, while Indian government is using this attribute to build a strong “Brand India”, it should not be illiberal while incentivising its service providers. It’s high time gov- ernment starts taking services exports seriously! From an industry that records a turnover of close to 10 times of India’s GDP each year, there is much to be learnt. Actually, there much to earn too! The Dollar Business™ has a focused reach. We don’t cater to the everyday Toms who want to flip pages to catch a glimpse of Marilyn Monroe or read what a novice has heard through the grapevine about some business going bust. Our content isn’t priceless in that respect. Our readers desire serious information that either supports their case or gives them an understanding that can be priced. Our readers are either stakeholders in the business of export-import, or have a keen interest in what this indus- try has to offer. Like we say, we just know one dimension – global trade, and most definitely, all our readers have a serious interest in both our articles and the advertisers. “SERVICE TAX REFUND PROCESS SHOULD BE SIMPLIFIED” O exports and hence, it finds it extremely difficult to fathom and value Services exports. Al- though things have improved in recent years, the fact that Services can’t be felt, weighed, seen or touched means that our tax department doesn’t take them as seriously as they should. In my dealings with service providers, I have come across several cases where service tax refunds are pending for the last nine years. Some estimates suggest that service tax refunds of several hundred crores are pending just in Hyderabad. With laws regarding the definition of service exports having gone through several changes over the last decade, interpretation has become a major issue. What the gov- ernment should aim to do is simplify the definitions and get rid of ambiguity. Proper coor- dination between the Ministry of Commerce and the Ministry of Finance should achieve this. Two more issues that I would like the government to address are the high con- centration of Software Technology Parks in the southern states and non-transferability of the Served From India Scheme (SFIS). While the high concentration of STPs in the South has been a boon to the southern states, the government should investigate the reasons for them not coming up in other parts of the country. SFIS has also been a big disappointment, with just 1,332 authorisations and Rs.982 crore of duty credit scrip in the first eight months of FY2014. The SFIS had initially been envisaged as a brand building exercise but has abjectly failed in achieving it. One main reason that I feel has caused this is the non-transferability of the duty credit scrip. Without transferability of duty scrip, a lot of service exporters feel let down as not having the need to import in the near future is resulting in them just sitting on their duty scrip, without any form of compensation. I think the government should seriously consider approving a long standing demand of service exporters to make duty credit scrip provided under SFIS transferable. ne of the basic reasons for Service exporters facing a lot of hardship while trying to get Service Tax refunds is the intangibility of their exports. Export of Services is a new concept for the Indian bureaucracy which is used to handling merchandise ANANTHA NARAYANAN S., Director – Tax and Regulatory Services, PricewaterhouseCoopers To cater to such a focused reader group, we don’t just do with everyday content creators and field reporters who know little about the vast subject of foreign trade. We have content specialists on board who have dealt with foreign trade as a platform for decades. This expert editorial panel functions pan-India – from the financial capital of India (Mumbai) to the political capital (Delhi), from the Silicon Valley of India (Hyderabad) to the former capital of British India (Kolkata). In fact, the next time you sit sipping Darjeeling tea, there is a chance that we actu- ally would have a fat-glassed analyst roaming the sloped hills where tender apical tea shoots are being plucked. His task – to make our reader something more than just a tea-sipper. How about…a tea exporter with a turnover of a few crore rupees? Excited? 66 THE DOLLAR BUSINESS II AUGUST 2014
COVER FEATURE FOREIGN TRADE POLICY – WHAT THE INDUSTRY WANTS T received in Indian rupees or free foreign exchange and that they should have been supplied within the political boundaries of India. For example, if a two-wheeler spare parts manufacturer based in Pune, supplies rear view mirrors to a motor- cycle maker, who has availed EPCG au- thorisation, then the rear view mirrors sale would be considered Deemed Ex- ports. Or, if a farmer based in Telangana supplies turmeric powder to a pharma- ceutical unit based in a Biotechnology Park, then the turmeric powder sale would be considered Deemed Exports. In fact, supply of goods manufac- tured/produced in India and supplied he basic criteria for defining something as Deemed Exports is that manufacturing of those goods should have happened in India; their payment should have been against Advance Authorisation/Duty Free Advance Authorisation or to an EOU/STP/EHTP/BTP would all be considered Deemed Exports. Supply of goods to even any project funded by UN agencies are also considered as Deemed Exports. And the main benefit of being considered as Deemed Exports is that one can avail the benefits of Advance Authorisation/DFIA, Deemed Export Drawback, among others. But as they say, the devil lies in the details. And Deemed Exports is no dif- ferent. The trouble is Deemed Exports has become almost unmanageably com- plicated. So many circulars and notifica- tions have been issued on Deemed Ex- ports over the last few years that keeping a proper track of it has become almost impossible. Similarly, although the gov- ernment pretends to deem Deemed Ex- ports as real physical exports, it is not willing to give the full benefits of exports to Deemed Exports. A case in point is Central Sales Tax (CST), which is ex- empted for physical exports but not for Deemed Exports. For example, if you are exporting a carpet, you are exempted from paying CST, but if you are selling wool to a carpet maker, which is ulti- mately used to make the carpet, you are being forced to pay CST! What the government should really do to benefit those who are currently supplying goods that are covered under Deemed Exports is scrap the chapter on Deemed Exports! Instead, the upcoming FTP should have a new chapter, just try- ing to define what qualifies as Deemed Exports and then treat everything that meets the criteria the same way we treat any other physical export! DEEMED EXPORTS DON’T JUST DEEM, TREAT THEM AS REAL EXPORTS A culture that credits a little squirrel carrying grains of sand to have contributed in Lord Rama build the bridge to Lanka, it’s only logical that even those who supply goods to end-exporters are also considered as exporters! Named Deemed Exports, the idea behind the scheme is to incentivise all who play a part, however little it might be, in the growth of exports from India. But is it happening? “WHY A STEP-MOTHERLY ATTITUDE TOWARDS DEEMED EXPORTS?” T Technology Parks or are supplied for specified infrastructure projects. The question then arises as to if something is, anyway, deemed as exports, why shouldn’t it get the full benefit of exports? For example, while physical exports are exempted from paying Cen- tral Sales Tax, no such benefit has been extended to Deemed Exports. Such differential treatment not only undermines the whole object of the scheme but also leads to cas- cading effect of taxes in such supplies. It is, therefore, important that such supplies are treated at par with real exports under all tax laws. Undoubtedly, treating Deemed Exports at par with physical exports and extending all the benefits of the latter to them is too big a step to take right away. So, the least the government should do in the upcoming foreign trade policy is to consolidate all the policy, circulars, trade notices and notifications that have been issued with respect to Deemed Exports. For, there have been so many of them that they have become confusing even to lawyers like me! Another step that I would like the government to take as regards to Deemed Exports is to extend the benefits of such scheme to projects that might not have been allotted though International Competitive Bidding (ICB). This is because not all of our major infrastructure projects necessarily go for ICB. Moreover, with the focus of the current government on infrastructure development, we should extend the purview of Deemed Exports beyond power and fertiliser projects or projects financed by specified agencies, to something like (say) ports. Deemed Exports is a scheme, which is still evolving and suffers from too many com- plications, which further lead to difficulty in understanding and tedious paperwork. While it, no doubt, is a great initiative to incentivise all those who don’t directly export but con- tribute a lot to India’s exports or infrastructure, the government should try and make the scheme more implementable through simplification. he main purpose of introducing the Deemed Exports scheme was to extend the benefits of exports to those goods that are not physically exported but either con- tribute to exports such as in case of supplies to Export Oriented Units or Software SANDEEP CHILANA Principal Associate (Indirect Taxes), Amarchand & Mangaldas & Suresh A. Shroff & Co. (AMSS) A local fisherman selling his catch to a marine exporter at Mumbai harbour: Such a sale of products that are thereon processed and exported by the intial buyer (under many circumstances) are con- sidered Deemed Exports. But the scheme suffers from ambiguity and hence, has not found many takers 68 THE DOLLAR BUSINESS II AUGUST 2014 AUGUST 2014 II THE DOLLAR BUSINESS 69
DOCKYARD KAMARAJAR PORT (FORMERLY ENNORE PORT) INDIA’S LANDLORD PORT – A PROFESSIONAL DELIGHT After covering India’s biggest major port Kandla in our last edition, we decided to head to the south-east for an on-ground health-check of India’s first and only corporate major port – Kamarajar Port. Yes, Ennore Port has been rechristened. The first pleasant surprise, probably a benefit of corporatisation, which one got while seeking appointment with its Managing Director was that it was done over email and a few phone calls, unlike most other major ports that still rely on fax! This built curiosity and we were eager to figure out if this was just cosmetic or corporatisation that has actually brought in some real changes. Here’s what we found – professionalism, efficiency, and the potential to excel! BY SISIR KUMAR PRADHAN A panoramic view of Tamil Nadu Electricity Board (TNEB) coal handling berth at Kamarajar Port. The Port is an artificial deep sea harbour. Two rubble mound type breakwaters with concrete capping provide tranquil environment inside the harbour and allow continuous berthing and cargo handling operations round the year 70 THE DOLLAR BUSINESS II AUGUST 2014 AUGUST 2014 II THE DOLLAR BUSINESS 71
DOCKYARD KAMARAJAR PORT (FORMERLY ENNORE PORT) C jor ports on Tuesdays since most of them conduct their weekly traffic and port op- eration related meetings with stakehold- ers on Tuesdays. But since Bhaskarachar had a packed schedule for subsequent days, we didn’t have much choice and landed in Chennai on a Tuesday morn- ing. There were a few more surprises waiting for us the moment we landed in Chennai. Firstly, the infrastructure in Chennai is far better than that in most metros in India. Even though metro rail construction in Chennai is in full swing, the Chennai Metro Rail officials have done a great job of carrying on construc- tion without disrupting regular traffic or dotting the roads with potholes, unlike their counterparts in other cities. Sec- ondly, Kamarajar Port Ltd. doesn’t wait for Tuesdays to conduct review meetings – they do it very professionally, as and when the need arises! hairman-cum-Managing Di- rector of Kamarajar Port Ltd. (KPL) M. A. Bhaskarachar confirmed the appointment for a Tuesday. Usually, we avoid visiting ma- that has since its inception been the most preferred port for a sizeable chunk of ex- porters, especially automobile exporters from Tamil Nadu. Sical Logistics’ coal terminal at Kamarajar Port. The terminal is solely responsible for supplying coal to TNEB (now TANGEDCO). It is the first in India to have an assured discharge rate of 40,000 TPD (tonnes per day). The terminal’s BOT agreement is for a period of 20 years and it is equipped with fully automated unloading and material handling equipment and conveyor systems THE EVOLUTION KPL was conceptualised as a satellite port of Chennai Port Trust (CHPT). Tamil Nadu has been among the top five major exporting states in India and most of the cargo from it is being routed through CHPT. But, with the establish- ment of production facilities by major automakers like Nissan, Renault and Ford, apart from many more original equipment manufacturers (OEMs) and a host of export oriented heavy, medium and small industries, Chennai Port was just not in a condition to handle the ris- ing traffic, resulting in congestion. With the growth of the city as a major business hub, CHPT authorities had very little land to expand or to provide storage and parking space to incoming vehicles. In a bid to ease congestion at CHPT, the In- dian government envisioned a new port a little away from city limits. A location close to an industrial corridor and far from human habitat was chosen for the purpose. CHPT was appointed as the implementing agency for the Ennore Port project. The project was sanctioned on April 23, 1993 and the Port was incor- porated as a public limited company in October 1993 under the Companies Act, 1956. It was declared as a major port and its limits were brought under the Indian Ports Act on May 23, 1999. This year EPL was renamed as KPL. The Government of India and CHPT respectively have stakes of 66.67% and 33.33% in KPL. Initially, CHPT invest- ed around Rs.445 crore, excluding the cost of the land, for the development of the port. Additionally, a loan of Rs.431 crore was allocated by Asian Develop- ment Bank (ADB) towards developing the Port. Thereafter, the operations of the port were handed over to the man- agement of the company. BORN OF A VISION The Government of India (GoI) has initi- ated the process of reorienting strategies and infusing fresh ideas to transform In- dia’s major ports into viable, feasible and productive assets. The main objective of this strategy is to divest out of major ports and provide the port’s management with operational flexibility. As a part of this strategy, Ennore Port Ltd. (EPL), very recently renamed as Kamarajar Port Ltd. (KPL), became the first major port in the country to get a corporate identity. It was also established at a crucial junc- ture – when there was dire need as the Chennai Port Trust (CHPT) had reached a saturation point. Even before the pri- vate sector could rush to fill the space, the Shipping Ministry established KPL – pacity of 0.5 MMTPA were constructed. The Government of India, which is in- curring huge expenditure in paying sala- ries and retirement benefits to the large work force at major ports, planned KPL as a ‘Landlord Port’. The landlord model vests the port with autonomy to manage resources and provide basic infrastruc- ture. It has licensed the development and operation of cargo handling terminals on build-operate-transfer (BOT) basis to private players and is setting a bench- mark for the public-private partnership (PPP) model. Interestingly, it has just 100 people on its payroll, unlike the oth- er major ports in the country where em- Electricity Board (TNEB) – now Tam- il Nadu Generation and Distribution Corporation or TANGEDCO. Initially, it was dedicated to handle coastal coal coming from Odisha and Visakhapa- tnam ports, and in some cases import- ed coal to feed TANGEDCO’s thermal power plants. During the second phase of development, a 3 million metric tonne per annum (MMTPA) liquid terminal, a 8 MMTPA common user coal termi- nal and a 12 MMTPA iron-ore terminal were set up in public-private partnership (PPP) mode. Later, an automobile/gen- eral cargo berth with a capacity of two lakh cars per annum and other cargo ca- ployee count runs into thousands. The Port is an artificial deep sea harbour. The two-rubble mound type breakwaters, with concrete capping fa- cilitates, allows continuous berthing and cargo handling operations round the year. The Port has six berths of which two berths have been exclusively dedi- cated to handle coal for TANGEDCO. Sical Logistics, which has a long-term agreement with TANGEDCO, has built a mechanised coal handling facility at the port under the BOT model. Another berth has been allotted for common user coal imports and is operated by Chetti- nad International Coal Terminal. An- Traffic handled by KPL In FY2014 KPL saw the highest growth in traffic among all major ports 30 25 20 15 GOVERNMENT OF INDIA OWNS 66.67% AND CHENNAI PORT OWNS 33.33% STAKE IN KPL 10 SPREADING WINGS KPL, the 12th major port of India, was commissioned in 2001, primarily to handle coal supplies to the thermal power generating units of Tamil Nadu 5 0 FY10 FY11 FY12 FY13 FY14 Coal Iron Ore POL Others Source: KPL Annual Report; figures in MMT 72 THE DOLLAR BUSINESS II AUGUST 2014 AUGUST 2014 II THE DOLLAR BUSINESS 73
DOCKYARD KAMARAJAR PORT (FORMERLY ENNORE PORT) Pointing out the geographical advan- tage Bhaskarachar says, “Our advan- tage is that we are close to a metro like Chennai and have got good rail and road connectivity to the hinterland. We have a big land bank. In fact, we have recently acquired around 650 acres of land, which gives us the flexibility to expand. We are going to develop many port based indus- tries, storage yards and parking yards that we hope will attract new users. This port was created 13 years back and the cost has already been recovered. This helps us to provide services at very com- petitive price. Since we don’t carry the baggage of a huge workforce, we are very competitive.” Until a few years back, auto export- ers were scouting for other options due to the congestion at CHPT and found a solution in KPL. The contribution of auto exporters to KPL’s success can be gauged from the fact that almost 10% of its revenue comes from this sector only. According to Sanjay Kumar, “Auto ex- ports grew at a rate of 52% in FY2014. Around 2 lakh cars were exported from the port in FY2014, which is less than 2% of the total cargo handled at the port, but it fetches good revenues.” Dayalan Bernard, General Manager, Ennore Automotive Logistics – a con- sultant to KPL, told The Business Dol- lar, “Though the company has export agreements with only Nissan and Ford, other automakers are also coming to the port. It’s because the Port offers clean environment and good storage facilities.” DESPITE CHARGING 15-17 BPS MORE THAN ITS COMPETITORS, THERE’S A BEELINE EXPORTERS AT KPL OF AUTO ment and have just 100 employees. This helps us to check salary and pension liabilities, which is reflected in our bal- ance sheet.” Adds CARE Ratings’ AGM (Corporate Ratings) P. Sudhakar, “The port, because of its corporate structure, has a faster decision making capacity. It has a low risk profile and assured earn- ings from captive users. Its key growth drivers are a steady rise in coal imports and increasing car exports. Unlike other Nissan Micra cars driving into a RO/RO (roll-on/ roll-off) vessel docked at Kamarajar Port. KPL, with its own investment, has developed an automobile/ general cargo berth for handling automobile exports and imports and other general cargo at a cost of Rs.140 crore COMPETITIVE EDGE The KPL model has many built-in ad- vantages when it comes to freedom of operations. According to Bhaskarachar, “We have a Landlord model manage- connectivity to the NH4, NH5 and NH45 through state highways bypassing the Chennai city. This helps ease cargo-lad- en vehicular movement. Elucidating the facilities at the port, KPL Director (Op- erations) Sanjay Kumar told The Dollar Business, “The port channel has a 16 me- tre draft and permits a maximum draft of 13.5 meters at all berths except the automobile cargo berth where the max- imum draft is restricted to 10.5 meters. On completion of our ongoing Phase-II dredging, the existing draft will rise to 20 meters in the channel and 18.50 meters in the basin which will enable the port to handle capesize vessels.” Kamarajar Port’s hinterland includes major cities like Chennai, Coimbatore and Bangalore, which give it the advan- tage of attracting large volumes of cargo. Moreover, following the ban imposed by Madras High Court on CHPT in 2011 on handling polluting cargoes like coal and iron ore, cargo has moved to oth- er nearby ports. And KPL is the biggest beneficiary. Numbers stand testimony. In terms of cargo handling KPL recorded the highest growth rate among all major ports in FY2014. It handled 27.33 MMT cargo during FY2014 against 17.89 MMT in FY2013, a growth of 52.8% y-o-y. Just how well KPL is doing can be judged from the fact that the next best – Paradip – recorded a growth of just 20.2%. The Chettinad International Coal Terminal (CICTPL) has two ship un-loaders connected to a mechanical automatic conveyor. This synchronised system can discharge 3,500 ton/hour from a ship. The closed conveyors prevent rain water from seeping in and air pollution Kamarajar Port’s car yard has a back-up area of 1,41,000 sq. mt. and has parking space for 10,000 mid-size cars in addition to the transit parking area of 25,000 sq. mt. other berth managed by BOT operator Ennore Tank Terminals Private Limited (ETTPL) is dedicated to handle liquid cargo. The cargo being handled at the terminal presently comprises petroleum, oil, lubricants, LPG, carbon black feed- stock and chemicals. KPL entered into a licensing agreement with SICAL Iron- ore Terminal Limited (SIOTL) in 2006 for handling iron-ore. However, this remains idle due to the ban on iron-ore export in Karnataka. KPL has also, with its own invest- ment, developed an automobile/general cargo berth. The berth, with a capacity of 10,000 cars, can accommodate the world’s largest carriers. It has entered into an agreement with Nissan Motor India for use on a need-based basis, with a minimum assured traffic of 60,000 cars every financial year. Moreover, Ford, Toyota, and Ashok Leyland are also us- ing the facility to export their vehicles. AT THE RIGHT PLACE KPL is a greenfield project situated close to a major industrial city, Chennai. It has 2,118.74 acres of land. The port has good 74 THE DOLLAR BUSINESS II AUGUST 2014 AUGUST 2014 II THE DOLLAR BUSINESS 75
DOCKYARD KAMARAJAR PORT (FORMERLY ENNORE PORT) major ports, KPL has the freedom to fix its tariff as per market requirements.” The responsibility of development of common infrastructure facilities like capital dredging and road & rail con- nectivity is vested with KPL. For this, it needs to raise massive amounts from the market, with no government assistance. Although the company has a healthy rev- enue model, it got very poor response to its tax-free bonds’ issue last year. It man- aged to raise only Rs.94.65 crore against an issue size of Rs.250 crore. “The port recently sold around 350 acres of land to arrange Rs.500 crore, which will be used for development of common infrastruc- ture,” says Kumar. Clarifying the reason for such poor response to the bonds, Sudhakar points out, “The Port issued the bonds at a time when a lot of oth- er PSUs were also tapping the market. Hence, there weren’t many takers for KPL Bonds. However, the Port has good incremental cash flow and it registered a PAT of about Rs.300 crore in FY2014.” A RECENT BOND ISSUE BY KPL SAW EXTREMELY LACKLUSTER INVESTOR INTEREST NOT ALL HUNKY DORY Although the Port has been recording outstanding growth rates year-on-year, critics claim that there is more than meets the eye. “We have only CHPT and KPL to export our vehicles. There is a ban on vehicle movement to CHPT between 5 am and 10 pm. So, we have no choice but to depend on KPL and pay higher charges,” Venkat Manukonda of Renault Nissan Automotive told The Dollar Busi- ness. He adds that KPL should reduce port charges to attract more users and it necessarily needs to have dedicated cus- toms officials at the Port itself. Speaking on the non-availability of customs officials, a top-level officer at Chennai Customs, on condition of an- onymity, told The Dollar Business, “KPL authorities are not providing basic facil- ities like office space, cargo examination area and transportation. As a result, our officials are reluctant to visit the Port.” Further, according to the same official, “The Port currently serves a limited number of captive users and has plans to open more multi-cargo common user berths in the future. The Port authorities will have to change their attitude and be- come more communicative to users and customs, otherwise it will be difficult for the Port to stay in the race.” When questioned about the reason for the higher tariff at the automobile cargo berth, Daylan Bernard pointed out, “KPL car berth is a newly developed facility. This is why the Port is charging higher tariff to recover its investment. However, as the time goes by and depreciation of the assets take place, the tariff will come down. In FY2011 when car export start- ed from the Port, it charged 0.45% of FOB. Today it has come down to 0.40%, and by the end of December 2014 we have proposed the Port authorities to reduce it further to 0.34%.” It’s worth not- ing that the average tariff in other ports in India like Mumbai Port and Nhava Sheva is just 0.23-25% of FOB value. Further, although the Port authorities claim that the car yard has a capacity of 10,000, the Port has space for just 8,500 hatch-backs if the reserve area being used for vehicular movement and washing is deducted from the total space available. Presently, vehicles are shipped out from KPL mostly through roll-on/roll-off (RO-RO) vessels. Be as it may, KPL still happens to be the first choice of several A view of CICTPL’s wagon loading system. The wagon loader can load 1,600 ton/hour, thereby loading one rake of 59 wagons File photo of the first project cargo vessel – MV PAC ATHENA – that anchored at Kamarajar Port after it started operations in 2001 within capacity project cargo carriers will be able to enter the port.” Having spent a few days at Ennore and being a first-hand witness to how Ka- marajar Port Ltd is a country mile ahead of most other major ports in India – in terms of infrastructure and professional- ism – we are sure that its management will do whatever it takes to ensure that KPL maintains its superiority. The burning question, though, is just why can’t other major ports in India be as professional as this Landlord Port? Per- haps, other port trusts have their own reasons big carmakers. For instance, Honda Cars India Ltd., which manufactures cars at Greater Noida in Uttar Pradesh and Bhi- wadi in Haryana, prefers KPL over other ports on the west coast, despite proximi- ty, primarily for its facilities. ANCHORED DEEP KPL has the potential to grow on a much faster pace if the management improves the infrastructure and storage facilities. Stressing more on connectivity, Bernard said, “The Port management has to fo- cus more on improving connectivity and parking space. If the officials could remove the over-head railway cable that passes through the entry gate, higher approximately 2.5 hours sisir@thedollarbusiness.com Turnaround time at Indian major ports KPL management is trying hard to reduce turnaround time to attract more users Capacity utilisation at India’s Major Ports KPL’s capacity utilisation in FY2014 was next only to Mumbai and JNPT 140 6 120 5 100 4 80 3 60 2 40 1 20 0 0 Kolkata Haldia Paradip Vizag Kamarajar Chennai Tuticorin Cochin New Mormugao JNPT Mumbai Kandla All Ports Kolkata Haldia Paradip Vizag Kamarajar Chennai Tuticorin Cochin New Mormugao JNPT Mumbai Kandla All Ports Mangalore Mangalore Source: Ministry of Shipping, GoI; number of days Source: Ministry of Shipping, GoI; figures for FY2014 76 THE DOLLAR BUSINESS II AUGUST 2014 AUGUST 2014 II THE DOLLAR BUSINESS 77
EXCLUSIVE INTERVIEW “WE HAVE DECISION MAKING AUTONOMY, UNLIKE OTHER MAJOR PORTS” M. A. BHASKARACHAR, CMD, KAMARAJAR PORT LTD. WE DON’T REALLY INCUR ANY EXPENDITURE IN RUNNING THE PORT AS MOST OF ITS OPERATIONS HAVE BEEN PRIVATISED OR OUTSOURCED marajar Port. There is demand and supply mismatch. Do you think there is enough cargo to feed both the con- tainer terminals? MAB: Adani will start work on the con- tainer project this month and it is expect- ed to be completed by mid-2016. The container cargo growth is there to feed all the ports, and in the next 4-5 years it will double. Recently when Chennai Port Trust also decided to upgrade its con- tainer handling capacity, it carried out an extensive survey to assess the container- ised cargo volume. Only after it did they give the green signal to the project. How- ever, that project seems stalled as of now. So, we are taking up that opportunity. We have conducted market surveys and the consultants have found out that the container traffic, as studied by Chennai Port, will be available in a year or two. Temporarily, there is a feeling of excess of supply compared to demand because of recession in developed economies. Ennore Port, officially renamed as Kamarajar Port Limited (KPL) early this year, has come a long way since its inception as a satellite port to the Chennai Port in 2001. The port has not only registered steady growth year over year, but is also planning to start its first container terminal very soon. The Dollar Business caught up with M. A. Bhaskarachar, Chairman-cum-Managing Director of Kamarajar Port Ltd., to find out how the port has managed to remain efficient and what’s the way forward for India’s first and only major corporate port. Excerpts: INTERVIEW BY SISIR PRADHAN TDB: Kamarajar Port Ltd. (KPL) is the first and only major port in the country to be set up under the Companies Act. Operation-wise, how does it help you score over other major ports? M. A. Bhaskarachar (MAB): We are a ‘Miniratna’ company. So, the powers delegated to such companies and its of- ficials are available to us as well. Dele- gation-wise, we are far better than Port Trusts and are able to take quick deci- sions. We can easily enter into agree- ments with private parties for business, without going through the process of government approval. Moreover, we have authority to appoint people below the board level. In terms of administra- tion too, there aren’t many government interventions. We have defined power which gives us the freedom and flexibil- ity to take timely decisions in the inter- est of the company. Further, we operate on the ‘Landlord Port’ model, wherein the port provides basic infrastructure and manages resources. The port has li- censed the development and operation of cargo handling terminals on build– RTI and many more audit requirements. So, while working for a government or- ganisation, one has to be very transpar- ent and follow a lot of procedures, which is really time consuming. For instance, if there is a requirement for a crane, I can’t just go ahead and buy it. Although I don’t need to go to the government or the Ministry of Shipping for approval, I do need approval from the Board for any big investment. Moreover, there are certain time consuming procedures that needs to be followed, like tendering which in- cludes prescribing specifications, going for open tender etc. operate–transfer (BOT) basis through public–private partnership (PPP). The obligation to bring in capital related to cargo handling operations and ensure ef- ficiency in operations and management lays with individual BOT operators and captive users. are legacies of huge employee base and a major part of their expense consists of payments towards pension and other re- tirement benefits. In fact, ports like Kol- kata, Chennai and Mumbai have huge numbers of pension holders, somewhere in the range of 20,000-30,000. fulfills its obligation, the private party can impose a penalty or seek legal aid. As far as revenue sharing is concerned, land, waterfront and basic infrastructure is owned by us. So, we have all the rights to take a share in the revenue. TDB: Private ports in India are being managed with a low manpower. Why is the same not possible in the public sec- tor? Being a corporate port, you can set up and operate mechanised cargo han- dling without hiring too many people. So, why do you want third parties? MAB: Here again the willingness to take risks is involved. The preference of the government is the PPP model, which means you are less involved in day-to- day operations. In private sector you are answerable to one individual, but in public sector that is not the case. Too many agencies are involved and you are accountable to all of them. If you take commercial decisions, they will be ques- tioned. The problem is not with the offi- cials or their competency, it is with the system. We are covered under CBI, CVC, TDB: There are several instances of private partners complaining of not getting adequate support and facilities like railway connectivity, water and ad- equate storage area. Is this the reason why in recent times some private play- ers, even after getting the approval to start operations, have backed out? MAB: Private operators at KPL are get- ting a share in revenue. Under the PPP mechanism, a concessional agreement has been finalised and on the basis of bidding, an operator has been selected. As per the agreement, there are some obligations on the Port and some on the private operators. So, as per the conces- sional agreement, if the Port has agreed to provide some facilities, then it is com- pelled to provide it. If the Port doesn’t TDB: Chennai Port Trust has 33.33% stake in KPL. Does that put any kind of pressure when you compete with them? MAB: We are not a competitor to them. In fact, we want to grow together. KPL pays huge dividends to Chennai Port Trust, which is increasing every year. By now, we must have paid them more than their initial investment. We also have a very good synergy with them. For exam- ple, for cars, we handle a particular cus- tomer and they handle some other. We have not dragged anybody from Chen- nai Port. The user has selected us. TDB: long-term, what do you see? MAB: We are going to construct one more car terminal, one common user coal terminal and a liquid cargo termi- nal. These three projects will be taken up during 2016. An LNG project has been awarded to Indian Oil Corporation though the construction work has not yet started. Some other projects which have been awarded are: four new berths including one container terminal, one multi-cargo terminal, one LNG and one coal berth for TNEB. Discussions are also on with the government to make use of the iron ore facility for other cargo. When you picture KPL TDB: Last year you registered a growth of 30% in revenue but your operating expenditure increased by just 1.6%. How do you manage to keep expenses under control? MAB: One of the biggest reasons for this is that we operate with very few employ- ees (just 100). We don’t really incur any expenditure in running the Port as most of its operations have been privatised or outsourced. In other major ports there TDB: Tell us something about the con- tainer terminal construction allocat- ed to Adani? L&T has an operational container terminal very close to Ka- sisir@thedollarbusiness.com 78 THE DOLLAR BUSINESS II AUGUST 2014 AUGUST 2014 II THE DOLLAR BUSINESS 79
POLICY MONITOR “POLICYMAKERS SHOULD MOVE OVER TO LOGIC-BASED INCENTIVES FROM LOBBY-BASED INCENTIVES” MANIKAM RAMASWAMI, CHAIRMAN, TEXPROCIL WE SHOULD SCRAP THE HANDLOOM RESERVATION ACT, ALONG WITH THE HANK YARN OBLIGATION AS SOON AS POSSIBLE past three years, from $3,319 million in FY2012 to $2,244 million in FY2013 and $1,865 million in FY2014. This is very in- tersting a development. As far as export of cotton yarn is concerned, there was a 33% y-o-y growth in FY2014. Hence, there is widespread optimism. TDB: What are your recommendations to the government to boost export of cotton and cotton yarn? MR: Our suggestions are simple – move over to the logic-based incentives pro- posed several times by Texprocil from the present lobbying-based incentives and remove all uncalled for protection given to monopoly fibre manufacturers (viscose and polyester). This includes an- ti-dumping duties, higher tariff for inter- mediary products, higher incentives etc. We also recommend bringing all textiles, be it made out of cotton (consumed by the rich) or man-made and synthetic (consumed by the poor) at par when it comes to taxes, i.e., keep taxes at the low- est possible levels without exemptions. Appreciate the fact that 95% of the items reserved for handlooms are and have, over long periods, been produced on power looms. So, scrap the Handloom Reservation Act and with it the Hank Yarn Obligation (it is a mechanism to en- sure adequate availability of hank yarn to handloom weavers at reasonable prices. But in reality 75% of hank yarn is con- sumed by power looms and over 50% of the so-called hank yarn is actually cone yarn declared as hank yarn). We also want the government to appreciate the fact that handloom is a handicraft and include it with handicrafts and promote them with a view of helping the artisan (not worker) get his due. Anxiety is running high in the Indian textile industry, thanks to China’s new cotton policy. Presently, the price difference between Indian and Chinese cotton is quite high, with the Indian variety selling at a big discount. In fact, price of Indian cotton in China is lower than the Chinese varieties even after duties and taxes are paid. In an exclusive interaction with The Dollar Business, Manikam Ramaswami, Chairman, The Cotton Textiles Export Promotion Council (Texprocil), explains these concerns and talks about challenges the industry is facing. Excerpts: INTERVIEW BY JAYSHANKAR MENON forward profitability of Indian spin- ners will depend on the country’s price differential with global cotton prices? MR: Profitability of Indian spinners de- pend on cotton prices in India. At pres- ent, cotton prices in India are not declin- ing in tandem with international prices. sures does Texprocil take up to ensure visibility for its members? MR: Export promotional services ren- dered by the council include continu- ously undertaking vigorous marketing efforts around the world by showcasing the strengths of the Indian textile sector; providing market related information to members; organising group participa- tion in important fairs and exhibitions worldwide and promoting buyer-seller meets and B2B meetings in important markets. In addition, our activities in- clude receiving trade delegations from major importing countries and provid- ing web-based ‘market place’ platform to our members. TDB: A Texprocil study reveals that India’s cotton yarn export, despite sea- sonal fluctuations, is meeting its tar- gets. Are you happy with the results? Manikam Ramaswami (MR): Seasonal fluctuations in demand should be con- strued as ‘no activity’ in the market. Even though export performance is almost on track month-on-month, there is a lot of scope to increase exports in the current year, provided Indian exporters do not undercut each other and expose them- selves to price conscious buyers. TDB: What is the main reason for In- dian exporters winning repeat orders from foreign markets? MR: The Indian spinning industry has got its own inherent advantages such as running spinning machines at high speeds as compared to any of our com- petitors. We also have advantages when it comes to raw materials and skilled la- bour, which allows us to produce high quality yarn at a price substantially lower than other spinners around the world. demand situation that will ultimately determine prices. TDB: Price difference between Indian and Chinese cotton is high, with Indi- an variety selling at a discount. Why should then our exporters be anxious? MR: It is reported that Chinese exports of finished textile and apparel products is slowing down due to various reasons. Although there is enough headroom to maintain our price levels of cotton yarn, owing to below normal export orders for finished products there is increasing pressure on raw material prices. In recent months, there has been a mismatch in asking price and offer price to the extent of 10 to 15 US cents/kilogram of yarn. Due to this mismatch in prices there is a slowdown in orders and is a cause for anxiety among exporters. TDB: There is a perceptible angst in the industry due to recent developments in China’s cotton policy as it is the biggest importer of cotton and cotton yarn from India. What is your take on this? MR: Even though China is the largest producer of cotton and cotton yarn, it is also the largest importer of cotton and cotton yarn in the world, mainly be- cause the weaving and knitting industry in China requires a lot of yarn. Installed spinning capacity in China actually con- sumes much more cotton than the total output of the country. Therefore, China will continue to be a net importer of cot- ton and cotton yarn. Every country needs to protect the interest of its farmers and China is no exception to this worldwide concept. However, it’s the supply and TDB: Can you explain the role that Tex- procil actually plays in supporting the exporter fraternity? MR: We at Texprocil are promoting ex- port of cotton yarn, fabrics, home tex- tiles and made-ups. Some of the import- ant support given to members include collectively refuting trade barriers/re- strictive practices imposed by importing countries, representing the industry in addressing policy and procedural relat- ed issues, actively engage in FTA nego- tiations with developed countries and collecting, collating and disseminating import/export data. TDB: What has been the growth of In- dian cotton and cotton yarn exports? MR: In FY2014 total export of cotton went up by 1.84% over the previous year despite a 16.89% decline in exports to China. In fact, export of cotton to Chi- na has been gradually declining over the jay@thedollarbusiness.com TDB: So, what export promotion mea- TDB: Do you also think that going 80 THE DOLLAR BUSINESS II AUGUST 2014 AUGUST 2014 II THE DOLLAR BUSINESS 81
PRIME FOCUS FREIGHT TRANSPORT PRIME FOCUS FREIGHT TRANSPORT BY NEHA DEWAN LOGISTICS DEVELOPMENT LOGICAL DRIVER TO INDIA’S GROWTH Cargo containers being transported via rails. Indian Railway s carried 953.05 million tonne of revenue earning freight traffic during April 1, 2013 to February 28, 2014 Whoever said roads are the blood vessels of an economy, probably forgot to mention rails, sea ports and airports! And if all of them together are indeed the blood vessels, then India is definitely headed for a full-fledged heart attack. For, not only are our roads clogged, railways overburdened and airports too expensive but also stores and warehouses, grossly inadequate. The fact that China’s top port Ningeo-Zhoushal handles more cargo than all major ports in India put together, sums up all that’s wrong with Indian logistics sector BREAKUP OF INDIAN FREIGHT Unlike China and US, roads still carry most of India’s freight traffic 60% ROADS 32% RAILWAYS 7% COASTAL 1% AIR / OTHER Source: Industry sources; breakup for FY2014 82 THE DOLLAR BUSINESS II AUGUST 2014 AUGUST 2014 II THE DOLLAR BUSINESS 83
PRIME FOCUS FREIGHT TRANSPORT L the sector is such that it can easily chart out India’s success story, albeit if tapped in the right way. The logistics sector in India, in essence, primarily comprises of freight and transportation via road, rail, air and water, as well as, other an- cillary sectors like warehousing and cold storage. However, the distribution of various modes of transportation in India shows a dramatic contrast to that of other countries, with road networks making up 60% of total freight traffic. As compared to this, roads account for 37% of freight traffic in US, while the corre- sponding figure in China is just 22%. Rail and coastal shipping come next in line in India, constituting approximately 32% and 7% respectively. On the other hand, inland water transportation and air account for less than 1% each. Estimates peg the Indian logistics market at $125-130 billion, and is be- lieved to be growing at a steady rate of 15% per annum. And though hurdles do exist before India can scale up to inter- national competitiveness and efficiency, the forecast for the future looks hopeful and bright. Agrees Jaideep Ghosh, Part- Although the quality of the main highways in India has improved significantly in recent years, they come nowhere close to global benchmarks ner and Head of Transport & Logistics, KPMG, as he tells The Dollar Business, “Rising investment, rapidly evolving reg- ulatory policies such as relaxed lending terms for infrastructure projects, free- ing up of road projects from mandatory PPP mode, mega infrastructure projects and the recent Union Budget announce- ments on multi-modal transportation initiatives are likely to trigger a higher rate of growth of the Indian transport and logistics market.” So, where exactly is the root of the problem, even though so many mea- sures are bound to accelerate growth? For one, the cost of logistics accrued in itself is high for the Indian economy even though labour costs are relatively cheaper. A look at logistic spends reveals that India’s logistics sector accounts for 13% of the GDP – higher than that in markets like US (9%) and Europe (10%) but lower than that in China (18%). ogistics infrastructure of any economy is a big indicator of growth, narrating the story of progress and development, or the lack of it. In India, the potential of INDIA’S LOGISTICS SPENDS ACCOUNT FOR 13% OF GDP , WHILE THE SAME FOR US AND CHINA ARE 9% AND 18% RESPECTIVELY work. Moreover, the 2.5 times increase in freight traffic, which is expected in the next decade, is bound to further strain the country’s inadequate infrastructure. The existing challenges are daunting enough and reveal the reasons for the lag faced by the sector. In its ‘Logistics Game Changers’ re- port KPMG highlights how road is more preferred than rail as the favoured mode for movement of goods in India. For in- stance, as per the report, while traffic on rail has grown more than ten-fold be- tween 1951 and 2007, rail track length only grew 1.4 times during the same pe- riod. Further, rail freight tariffs in India are known to be one of the highest in the world, with freight rates being near- ly four times of that in US. There is also lesser flexibility to carry different prod- ucts on rail as special wagons are not very easily available. Moreover, passen- ger traffic enjoys significant priority over freight when it comes to our rails. This implies that passenger tariff rates are highly subsidised by freight operations – they utilise up to 60% of network ca- pacity but end up contributing only 30% to revenue. But despite these operational hazards, rail networks have the potential to be the fastest and most cost effective transpor- tation for freight in India. Not only are the costs of rail transportation signifi- cantly lower compared to other modes, it also offers the advantages of speed and capacity-related factors. The over dependence on roads – about three times that of China – is also harm- ful for the environment as emissions from road transport are way higher than from rail and waterways. A more bal- anced distribution, in effect, would not only help lower transportation costs but also achieve higher efficiency and lead to more environment friendly zones. ROBBING PETER TO PAY PAUL It’s clear that a concerted effort to de- crease logistics cost is an important as- pect to increase the competitiveness of the Indian economy. According to indus- try estimates, India loses approximately $45 billion in terms of GDP every year due to inefficiencies of its logistics net- A truck carrying cargo to a warehouse near a port. Indian ports sector has seen a revolution in the last few years, thanks to the commissioning of several private ports potential to be an efficient mode for the economy but its’ share, as compared to developed countries, is very low. Coastal shipping and Inland Water- ways Transportation (IWT) make up domestic shipping. As compared to oth- er countries, India’s share of IWT stands at a dismal 0.5% as compared to 8.7% in China and 8.3% in US. Building on India’s IWT can lead to some obvious benefits of fuel and energy efficiency, lower air pollution as well as low capi- tal requirements. The other important mode in waterways – coastal shipping – is also integral for trade but remains largely untapped. Petroleum, oil and lu- bricants, coal, and iron ore are the major commodity categories accounting for most of India’s coastal cargo movement. The growth of the freight traffic share via coastal shipping, which at present hovers around 7%, is obstructed due to inade- quate port and land side infrastructure thereby blocking its large scale use. THE BEACON OF HOPE The Indian ports sector, on the other hand, has seen substantial growth over the last decade, with Gujarat enjoying a dominant position as the leading mar- itime state, handling almost a third of India’s total port cargo traffic and 71% of total non-major port cargo traffic. The sector is on a growth trajectory and initiatives such as the Maritime Agenda 2010-2020 by the Government of India is expected to further bolster port capacity. Launched in 2011, the agenda encom- passes an investment of $57.4 billion, in a phased manner, to create total port DEDICATED CORRIDORS Projects similar to the Dedicated Freight Corridor (DFC), according to the report, can help in fulfilling such objectives. The project that proposes construction of two corridors – one each on the west and east routes – is currently running significant- ly behind schedule. The DFC network, once executed, is expected to increase the share of rail considerably, leading to a more balanced distribution mix in the logistics sector as a whole. Besides rail, water as a mode of transport has the Image of a freight station at night. Indian rail connectivity has not scaled up as significant as was expected after independence 84 THE DOLLAR BUSINESS II AUGUST 2014 AUGUST 2014 II THE DOLLAR BUSINESS 85
PRIME FOCUS FREIGHT TRANSPORT terminals in India do not offer separate facilities. Also there are suitable waiting areas for trucks globally, whereas it is the cargo terminal landsides that are used for parking or holding area for trucks in India, thereby causing congestion. Increased spending on airport infra- structure might help improve air car- go infrastructure across India. The 12th Five Year Plan (2012-17) has earmarked investments worth Rs.67,500 crore on airports – an increase of 86% – over the investment outlined in the 11th Plan. Freight being loaded into an aircraft using via a loading platform Cardboard boxes being moved in a warehouse using a forklift stacker loader “We need a paradigm shift in the fabric of our thinking” three fronts – creating an environment for the Indian logistics market to offer value propositions in logistics solutions, increased capability of the Indian logis- tics industry to offer these solutions and lastly, governmental and other regulato- ry mechanisms to offer such an enabling environment. Regulatory framework by the government, in particular, assumes utmost importance. Apart from efforts to fill the infra- structural gaps, many other changes can help to make this more effective. Efforts such as coordination among various agencies in infrastructure plan- ning, improvement and simplification of tax regimes, reforms in urban planning and improving dialogue with regulatory agencies are some suggestions provided by the Deloitte-ICC paper. It’s well known that India will stand at an obvious advantage if a more balanced modal logistics infrastructure network is lined up ahead. Besides cost savings and efficiency in the overall freight system, they offer environmental benefits such as reduced energy consumption and lesser air pollution. Significant growth drivers for the logistics industry is an- ticipated from factors such as growth in industries like auto, pharma and FMCG; increase in trade flows; private sector investments and the development of lo- gistics infrastructure. In addition to this, policy changes for every mode of trans- port and increased investment in each of them can imply more effective freight movement and progress for the industry – something that is extremely important for India to get back on the high growth path. After all, you can’t zoom ahead on a bumpy lane! the warehousing sector. Ankur Minda, Manager (Corporate training) at Acorn Warehouses and Logistics Parks, feels increased Internet penetration in the country has led to many such portals springing up, signaling an opportunity for the warehousing segment. “There are a lot of e-commerce companies that are now doing well in the market. Flipkart, for example, has taken up 3 lakh sq. ft. of space in Bhiwandi. These companies require good warehousing facilities and hence they want to partner with logistics companies to stock their goods for more efficient deliveries to clients,” Minda told The Dollar Business. Similarly, some companies, while ex- panding their reach to e-commerce also speak of FMCG as a potential sector. “The growth of e-commerce industry of- fers great opportunities for the logistics industries to grow and generate higher revenues. Nevertheless, the big players in the industry are still focusing on the FMCG and consumer electronics sec- tors for their main business. The mid to smaller players in the industry, though, have a great opportunity to expand their business by catering to the growth wave in e-commerce,” Mandeep S. Sachdev, CEO, Elite Material Handling told The Dollar Business. But if real progress and scale has to be achieved, countering the problems within the sector by imple- menting innovative and long standing solutions can be the best way forward for the future of the logistics industry in India. And Deloitte and Indian Chamber of Commerce (ICC) in the ‘Logistics Sec- tor – Present situation and way forward’ shows the road ahead for the industry. TO STORE IT ALL A proper analysis of India’s logistics sector cannot be complete without a proper study of warehousing and stor- age facilities. The warehousing market in India comprises of both agricultural and industrial warehousing, with both segments having tremendous growth opportunities. The share of the indus- trial segment is expected to increase from 86% in FY2011 to around 90% in FY2016. The demand for industrial warehousing space has also gone up to 476 million sq. ft. in 2013, up from 391 million sq. ft. in FY2010. Engineering Goods, Information Technology, Elec- tronics and Telecommunications sectors are expected to be the main drivers of this growth. In fact, the share of modern warehous- ing itself is expected to double from 15% in 2010 to 30% by 2015. Rising domestic and EXIM freight volumes, strengthened investment in infrastructure and organ- ised retail are some factors that will spur this growth. But as is the case in all the other segments, this sub-component also contends with its share of challenges that obstructs its growth potential. High price sensitivity among customers, to- gether with various infrastructure haz- ards, block the ability of service provid- ers to offer high quality services. One of the finest indicators of how an economy is doing, is the health of its transportation & logistics sector. It is more so in the case of developing/ emerging markets like India, with a number of challenges related to even basic infrastructure and processes. Evolution of the transport sector is both the need as well as the funda- mental requirement for India’s future growth trajectory. Firstly, there needs to be a clear drift from a ‘price’ driven logistics plan to a platform wherein one focusses on the overall ‘cost’ including the cost of ‘im- plications’ of the lack of service quality and performance. The newly created combined Transport Ministry should come up with a white paper on Corpo- rate Governance and business norms related to shipping, transportation and the logistics sector. This will streamline a number of issues, besides encourag- ing the outside world to look at this sector more favourably. All forms of compliance must take the center stage in our transport and logistics sector. Adherence to basic compliance norms related to HSSE (health, safety, security and environment), insurance and even anti-corruption, should be the modus operandi for this sector. The future of carriage/transportation sector is likely to be far more coordinated and also well calibrated between the various facets/modes of logistics. Conscious- ness and awareness towards greener capacity of around 3,200 million metric ton (MMT). The government also aims to create an additional cargo handling capacity of around 900 MMT at ports along the East Coast by pumping in an investment of around $22.5 billion. This initiative will encourage private investment in both major and non-ma- jor ports and aims to scale up Indian ports to international standards. Private investment is expected to contribute 66% and 98% to total investments in ma- jor and non-major ports respectively. Shankar Chatterjee Chairman, S CUBE Trans Continental Group UP IN THE AIR When it comes to the lesser used freight mode of air cargo, India has a long way to go even to be considered an also ran. A parallel between air cargo infrastructure at Indian airports and global practices highlights the lacunae – while there are segregated facilities for different types of cargo at the world’s top airports, most environment should henceforth be a necessity, if not a clear compulsion. As a way forward, we are likely to see the eminence of comprehensive lo- gistics service partners in India, rather than just pure transporters, customs house agents (CHAs) or even ship- ping lines. The concept of a single-stop shop is already gaining momentum. Competence on quality service levels should henceforth be a shared philoso- phy and not just cocooned into smaller cluster organisations. As a trend, more and more organisations should conflu- ence themselves into Logistics Con- sortiums, if not formal JVs. Finally, the government should be looked at more as a facilitator and not a manager of the freight and transportation business. RS.67,500 HAS BEEN EARMARKED FOR AIRPORTS IN THE 12TH FIVE YEAR PLAN, WHICH IS AN INCREASE OF ABOUT 86% THANKS TO THE WEB The Indian Warehousing Show (IWS) 2014 held in New Delhi recently was witness to a cross section of industry players. Interestingly, some companies that The Dollar Business spoke to, high- lighted how e-commerce companies are becoming a hot new favourite for WAY FORWARD The report says that action is required on neha@thedollarbusiness.com 86 THE DOLLAR BUSINESS II AUGUST 2014 AUGUST 2014 II THE DOLLAR BUSINESS 87
gy, including refrigeration & air-condition technology, automation, food retailing and food safety & quality management. The event will also have B2B meetings with food industry leaders in India and other countries, including giant retailers and processed food makers . INDIA FOODEX EXHIBITION Aug 22 – 24 Bengaluru www.indiafoodex.com India’s IT city will turn into the hottest des- tination for everyone in the food process- ing, packaging and equipment sectors in India as they converge at the India Foo- dex Exhibition in August. Last year, 353 delegates from 26 countries participated in the India Foodex Exhibition, which had about 33,700 visitors. This year, figures are expected to jump to 400 delegates, 30 countries and 45,000 visitors. plywood & panels, laminates, flooring, wood composites, particle boards, coat- ings, veneer, timber & lumber, doors & windows and other wooden products. 26,666 visitors thronged the place, of which around 24,000 or 90% of the visi- tors were from the industry. service equipment among others. LONDON EDGE Sep 7 – 9 London, United Kingdom www.londonedge.com Organisers of London Edge claim it is the most diverse and creative fashion trade show in the world. The event showcases over 250 collections and over 1,000 peo- ple from over 30 countries are expected to visit the event this year. A majority of the overseas buyers write their orders onsite, i.e., during the show. On exhibi- tion at London Edge will be exclusive, di- verse and extensive selection of creative fashion collections including men’s and women’s clothing, footwear, jewellery, bags, hosiery, giftware and accessories. CAMBODIA INTERNATION- AL TEXTILE AND GARMENT EXHIBITION Aug 15 – 18 Phnom Penh, Cambodia www.camboexpo.com A vast variety of industrial machines from top textiles and apparel companies around the world will be on display at the Cambodia International Textile and Gar- ment Industry Exhibition. The event is supported by the government of Cambo- dia to promote the local industry and get investments in the textile sector in both Cambodia and other ASEAN countries. This could be a good opportunity for companies looking to upgrade old equip- ment, seek co-operation and discover investment opportunities. [Global] JEWELLEX AFRICA 2014 Aug 2 – 4 Johannesburg, South Africa www.jewellex.co.za Jewellex Africa, which is being hosted by the Jewellery Council of South Africa for over 40 years had lost some shine over the years, at least that’s what the exhib- itors thought and hence, have decided to revamp the event this year. The event attracts local and international exhibitors who exhibit new merchandise lines, and exclusive and extensive product rang- es of watches, clocks, fine jewellery, pearls and precious stones, jewellery packaging, machinery, accessories and services. Have a product to showcase? Or want to learn what your rivals are up to? Here’s a list of trade fairs you shouldn’t miss in August and September 2014 [India] Exhibition-2014 will also hold a renew- able energy industry conference that will have views of 105 high-profile global speakers and industry leaders in plenary sessions, interactive keynote sessions, and CEO forums. Apart from this, panel discussions, poster sessions and busi- ness meetings are also planned to take place during the event. EAST AFRICA COM Sep 9 – 10 Nairobi, Kenya www.eaafrica.comworldseries.com Over 600 telecom, media & ICT profes- sionals are slated to participate in East Africa Com 2014, the premier communi- cations event in Kenya which is one of the most dynamic business hubs in Af- rica and a leading market for the digital sector. Last year, 208 companies from 28 countries participated in the event. In its 10th year now, East Africa Com has become the annual meeting place for East African operators and regulators to network and do business. AUTO EXPO 2014 Aug 8 – 10 Chennai www.indiaautoexpo.in India is expected to be the third larg- est auto market in the world by 2020 and playing a part in this growth story will be India Auto Expo 2014, a major event in the region which attracts top decision makers and representatives of the industry. On display will be the lat- est technological products, components and vehicles. The focus this year is on technological innovations in the areas of safety, environment and fuel efficiency. GRAINTECH INDIA 2014 Aug 22 – 24 Bengaluru www.graintechindia.com GrainTech India is considered India’s largest international exhibition on grains, cereals, spices, oil seeds, feeds and re- lated products and technologies. Over 26 countries participated in the event last year and the number is expected to grow to more than 30 in 2014. Around 45,000 visitors are expected to see dif- ferent products and the latest technology on display in over 350 stalls this year. GrainTech 2014 is supported by sever- al organisations including the Ministry of Agriculture, Ministry of Food Processing Industries, NABARD and APEDA. INTERAUTO Aug 28 – 31 Moscow, Russia www.eng.interauto-expo.ru The government of Russia-backed in- ternational exhibition InterAuto is a prominent exhibition in the automotive segment that brings together leading companies from around the world. More than 700 companies from 30 regions of the Russian Federation and 16 countries from elsewhere will participate in the trade fair this year. The exposition will showcase latest technologies in automo- tive components, spare parts, car care chemistry, car electronics and garage WORLD RENEWABLE ENERGY TECHNOLOGY CONGRESS AND EXHIBITION Aug 21 – 23 New Delhi www.wretc.in Organised by the Energy and Environ- ment Foundation and supported by the Government of India’s New and Re- newable Energy Ministry and Ministry of Earth Sciences, the World Renewable Energy Technology Congress and Ex- hibition-2014 promises to showcase the latest in the global green industry sector and bring together global renewable en- ergy industry leaders, experts, financers and consultants. The 5th World Renew- able Energy Technology Congress and Log on to www.thedollarbusiness.com for more events and details. File picture of negotiations in progress at Food and Bev Tech in 2012 FOOD & BEV TECH 2014 Aug 22 – 24 Mumbai www.foodbevtech.com The Indian food processing industry, es- timated at around $121 billion, accounts for 32% of India’s food market. The Food & Bev Tech 2014, which is back after a year’s break in 2013, claims it will have the entire industry covered. Organised by the Confederation of Indian Industry (CII) and supported by the Ministry of Food Processing Industries (MOFPI), the Food & Bev Tech 2014 will showcase various developments in food technolo- A participant displaying his award during World Food Moscow in 2013 WORLD FOOD MOSCOW Sep 15 – 18 Moscow, Russia www.world-food.ru A major meeting place for the global food and drinks industry, WorldFood Moscow features prominently on the APEDA dia- ry of events because of the large ethnic Indian population in South Africa. On for two decades now, the event is a major meeting place for the top brass of food companies across the world. In 2013, 1,634 companies from 68 countries, and WOODTECH INDIA 2014 Aug 23 – 25 Chennai www.woodtechindia.in It is the second edition of the fair but it is already considered India’s largest trade show for the wood industry and is ex- pected to provide a glimpse of how the industry is shaping up with a projected growth rate of 20% per year. Wood Tech India 2014 will be held in Chennai and will showcase the latest developments in woodworking machinery, furniture hard- ware & fittings, power tools, adhesives, Participants posing for the camera at Jewellex 2013, which is one of the main jewellery trade fairs in Africa and is being organised for the last 40 years 88 THE DOLLAR BUSINESS II AUGUST 2014 AUGUST 2014 II THE DOLLAR BUSINESS 89
NEW-GEN NEWSMAKER NEWSMAKER NEW-GEN RAJEN SHAH, MD, ARIHANT INDUSTRIAL CORPORATION RAJEN SHAH, MD, ARIHANT INDUSTRIAL CORPORATION CHANGING THE PERCEPTION ABOUT INDIA TOOK A LOT OF EFFORT BECAUSE WE WERE LOOKED AT LIKE THE CHINESE “WE DON’T SEE CHINESE COMPANIES AS COMPETITION” India has several examples of entrepreneurs who have dared to venture into uncharted territories and successfully chart their course to stardom. One such individual, Rajen Shah, Managing Director of Arihant Industrial Corporation Limited, in a freewheeling interaction with The Dollar Business, reveals what it takes to make waves in international waters, literally INTERVIEW BY SACHIN MANAWARIA TDB: What made you foray into this unique segment of water slides? RS: After graduation, I wanted to start something on my own and was not very interested in a job. This led to the birth of Arihant as a partnership firm between me, my elder brother Viren Shah, who used to work for L&T, and his very close friend Atul Safari, who worked for HTC. Arihant had a very modest beginning – with an initial investment of Rs.5,000 each by Viren Shah and Atul Safari. We were initially operating with only four machines out of a small 500 square feet premise at Goregaon in Mumbai. How- ever, the response from the market was good. In fact, after 2-3 years, both Viren exporting for the first time? RS: One of the main hurdles we faced initially was the image associated with India. We were generally equated with our Chinese counterparts, who typically had low quality product lines, which was not the case with us. This was the main reason why many international com- panies were not ready to consider us. Changing the perception took time and a lot of effort. However, I can proudly state that at present, seven-to-eight members of the global board of IAAPA – most of who own high-end water parks all over the world – are our clients. order and from where? RS: In the beginning, it was almost im- possible to compete at a global level be- cause big international players were just not willing to consider an Indian compa- ny for their water parks’ slides. This no- tion prevailed despite Arihant stringent- ly adhering to European and US quality standards. Later, we were fortunate to get a breakthrough in Sweden. Bidding price differential between us and the other major slide manufacturers was so big that the Swedish client thought of ex- perimenting with us, perhaps assuming that we would not be able to meet quality standards. However, when the equip- ment was installed, they were pleasantly and Atul left their jobs and joined the firm full time. Much later, during one of my visits to US, I noticed that water park slides over there were made of fi- ber glass. We, anyway, were already into playground equipment and were among the pioneers in making fiberglass slides for children. Given our expertise, man- ufacturing larger slides of fiber glass for water parks made perfect sense. We are one of the firsts in India to manufacture large water park slides indigenously and are now the market leader. turing water slides we confined ourselves to the domestic market. However, later, with an objective to get a foothold in the international markets, we started partic- ipating in global conferences and exhi- bitions of water and amusements parks conducted by international trade bodies like IAAPA (International Association of Amusement Parks and Attractions) across the globe. This helped us gener- ate leads and we started expanding our business globally. As a start, we got a few breakthroughs in smaller countries like Tanzania and Sri Lanka. surprised to see the quality of our prod- ucts were at par, if not better than global standards. Once they were fully satisfied, they started speaking highly about our products. This gave us a lot of word-of- mouth publicity and helped us expand, particularly in Europe. Today, we have five-to-six clients each in Denmark, Norway, Greece, Spain and Finland. We have also installed slides in about five water parks in UK and France and about ten-to-twelve in US. TDB: What strategies have you adopted to consolidate and expand? RS: In terms of competition, there are a few very large players in this business, TDB: How and when did you start looking at global markets? RS: Initially, when we started manufac- TDB: What were the biggest hur- dles that Arihant encountered while TDB: How did you get your first export 90 THE DOLLAR BUSINESS II AUGUST 2014 AUGUST 2014 II THE DOLLAR BUSINESS 91
NEW-GEN NEWSMAKER RAJEN SHAH, MD, ARIHANT INDUSTRIAL CORPORATION The water parks industry, which grew at a CAGR of 20.5% between CY2008 and CY2013, reported an annual turnover of $4 billion in CY2013. However, Indian players still have a long way go when it comes to this innovation-driven industry FOR ADVERTISING +91-40-6677 0765/66 ads@thedollarbusiness.com www.thedollarbusiness.com market leader in India, but also have our footprint in about 44 countries across the globe. TDB: What is your vision for Arihant? RS: We are currently a Rs.100-crore turnover company with around 30% of revenues coming from exports. Howev- er, given our higher thrust on exports, coupled with global recognition of Ari- hant as a brand in water slides, this ex- port ratio is surely poised to grow further during the next few years. We intend to at least double our turnover in the next three years. Further, we would like Ari- hant to be among the leading players in water slides business worldwide, if not among the top three. does have a presence in this segment but operates only at the domestic level and not on a global scale like us. Hence, there is no question of any competition aris- ing from Chinese manufacturers. Going forward, we also have plans of opening our offices in the Middle East, USA and Hong Kong to cater to the local demand. TDB: So what makes Arihant unique? RS: We handle water parks right from the conceptualisation of themes to plan- ning and manufacturing slides. We also take care of after sales services. On an av- erage, each such project requires around five acres of land and approximately 30- 120 days to complete. Arihant today has a strong reputation for developing water parks at par with global standards. This is the reason why we are not only the WE ARE NOT ONLY THE MARKET LEADER IN INDIA, BUT ALSO HAVE OUR FOOTPRINT IN 44 COUNTRIES ACROSS THE GLOBE like the Canadian firm White Water Park. We have already started giving them a tough time. In fact, they do have a few clients in Mumbai and Delhi and I think are watching us closely since we have started expanding across the globe with a footprint across nearly 44 coun- tries. There are a couple of smaller com- panies in Turkey and Netherlands. China sachin@thedollarbusiness.com 92 THE DOLLAR BUSINESS II AUGUST 2014
RENDEZVOUS “THE DRAWBACK RATES SHOULD BE RE-EVALUATED AND RAISED” SANJAY BUDHIA, CHAIRMAN, CII NATIONAL COMMITTEE ON EXPORTS & IMPORTS against the slowdown in the global economy. The stimulus is very much needed to help our exporters compete against their Chinese counterparts, who get a lot of special support from their government. India has been struggling to control its current account deficit and increasing exports should be a na- tional priority. The drawback rates should be re-evaluated and increased to encourage the exporting community. The transit time of exports from India across the Pacific or Atlantic oceans have continuously been increasing. This is because of regula- tions imposed by various foreign shipping lines and priority given by them to exports originating from the Far-East. Such delays are also making Indian exports uncompetitive in the international markets. Hence, creation of a national carrier to service these long routes is of utmost importance. INCREASING EXPORTS SHOULD BE A NATIONAL PRIORITY IF WE WANT TO CONTAIN OUR CURRENT ACCOUNT DEFICIT AT REASONABLE LEVELS AND ONE WAY OF ACHIEVING IT IS BY PROVIDING STIMULUS TO OUR EXPORTING COMMUNITY rates of interest, high interest rates definitely add tangible costs to the overall competitiveness of Indian exports. Low interest rates are very important for the availability of credit at a reason- able cost to our exporters. We should be globally competitive in terms of financing, cost of credit and availability of credit. Having a merchandise trade deficit of over $100 billion in each of the last four years can lead to many unfathomable consequences. With the new government at the Centre making all the right noises to boost exports and trade ties with neighbours, The Dollar Business caught up with Sanjay Budhia, Chairman, CII National Committee on Exports & Imports, to figure out what should be done to trim deficit and what to expect from the new foreign trade policy (FTP) scheduled to be released this month. Excerpts: TDB: India’s FTP has always been aimed at boosting exports from labour intensive industries. Do you think this is a flawed strategy since we are trying to kill two birds with one stone, which is unlikely to happen? SB: Focusing on labour intensive industries is very much re- quired and is a continuous process. Ultimately, we have to take care of our manpower, which is an asset for our country. We cannot move ahead by ignoring one sector. Hence, focusing on boosting exports from labour intensive industries is very important and much required. TDB: Lack of warehousing and improper logistics have also hampered India’s exports. Did you see anything in the re- cent budget announcements to feel optimistic on this front? SB: The Union Budget has definitely taken care of this require- ment. Big boost to infrastructure has been given in form of financing, environmental clearances and inland waterways among others. I think the government is conscious of what is needed to be done in order to boost exports. TDB: Our interaction with a lot of exporters reveal that India suffers from a poor brand image. Where do you stand on this and what should be done to create a niche brand like ‘Swiss Made’? SB: Branding cannot be done overnight. Creating a brand comes from quality of the products, the pricing, the sustain- ability and delivery of the products on time. That is how we can create and sustain our markets and ultimately that will help us create the Indian brand. This should be followed by marketing and advertising and holding seminars to promote brand India. CII organises a seminar on ‘Brand India’ in all major countries in the world with high level delegation in attendance. In fact, the new FTP is expected to include a long and medium term strategy to enhance trade competitiveness and overall growth of India’s foreign commerce with greater emphasis on identifi- cation of markets, providing branding assistance and assessing the need for free trade agreements with particular countries. The government will also be looking at promoting value-added products and strengthening India’s foothold in bigger econo- mies and regions like US and EU, where India has a relatively low share in total trade when compared to China and other emerging economies. TDB: India’s merchandise trade deficit has been over $100 billion every year since the financial crisis in 2008. What do you think has caused this and what should be done to reverse the trend? SB: The overall economic slowdown coupled with high oil prices has impacted not just India but other countries as well. But now, we are gaining momentum and I am positive that we will be back on the growth track very soon. INTERVIEW BY PURBA DAS TDB: Do you support extraordinary measures like what was done in case of gold last year to trim deficit? Is it time to reverse the decision? SB: We have to move with time. Any decision that is taken is a calculated one and should be changed if the situation demands. But such decisions cannot be reversed overnight. Changing them should be a well thought out decision. TDB: We have failed in our objective to double our exports in the three years to FY2014. Do you think the then govern- ment’s target was too ambitious? Sanjay Budhia (SB): India’s exports touched $312 billion in FY2014, registering a 3.96% y-o-y growth. But they fell short of the annual target of $325 billion for the second straight year. Following suggestions of various industry associations, the government is now open to considering a long-term export target of $750 billion by FY2019. I feel, instead of setting annu- al targets, it is a better idea to work on a long-term export target while having short to medium term sectoral reviews. TDB: As the Chairman of CII’s National Committee on Ex- ports & Imports, give us three main things you want to see in the upcoming foreign trade policy (FTP)? SB: The top three issues that should be addressed in the up- coming foreign trade policy (FTP) are revival of Special Eco- nomic Zones (SEZs), reimbursement of taxes and duties and the extension of Focused Product and Focused Market Schemes. Over Rs.2 lakh crore have been invested in SEZs, which account for close to 30% of India’s total exports and provide sizable employment. SEZs have a huge potential for increasing exports and needs stable policy. There are serious is- sues that have the potential to make all the investment made in SEZs go waste if no remedial measures are taken at the earliest. Exports made from SEZ-based units are not entitled to avail benefit of duty drawbacks and on top of it they are deprived from Focus Product Scheme (FPS) and Focus Market Scheme (FMS) as well. Also, given the current economic scenario, the government should announce stimulus to help exporters fight TDB: India’s trade with its neighbours, including Pakistan, has been dismal. What steps should the government take to strengthen the country’s trade ties with its neighbours? SB: It is the age of competition and cooperation – the reason our Prime Minister Narendra Modi invited heads of SAARC nations to his swearing-in ceremony. He also made his first vis- it to Bhutan and also sent the External Affairs Minister to Ban- gladesh. So, the new government is putting in all the efforts to strengthen its trade ties with its neighbours, and that certainly includes Pakistan. TDB: Interest rate subventions have been another area of focus in India’s FTP? Do you think that it has its limita- tions, since we anyway are a high inflation-high interest rate economy? SB: In India, the interest rates are among the highest in the world. Naturally, for exporters, every single penny counts. In a scenario where our competing countries have nil or negligible TDB: We rank a lowly 16th in the list of world’s top merchan- dise exporters. If proper policies are put in place, how far do you think can we scale up? SB: Our first target should be to get into the top 10. Our poli- cies should be directed towards climbing up the ladder. Once that is done, we can reach new heights. purba@thedollarbusiness.com 94 THE DOLLAR BUSINESS II AUGUST 2014 AUGUST 2014 II THE DOLLAR BUSINESS 95
BORDERLINE EDITOR’S COLUMN It’s not for everyone. It’s for the YOU in you. Express Yourself! GO CASHLESS WITH... Your Eyewear Brand Hit that Wimble- don winning back- hand winner three seconds before noon on a rainy Sunday YOUR BANK mWALLET Your Bag Brand No more going to a cash machine. Now you don’t have to pay those extra bucks at an expensive bureau de change. No more waiting or standing in a queue. It’s the end of cash! Power up your life with ‘Your Bank’ card. It’s freedom, it’s safety... it’s power in your hands. Go cash- less. Go places. Carry your world in style! BRICS HAS ARRIVED. FINALLY! T lenged the world order led by the West. After two years of tough negotiations, leaders of this five-nation bloc (Brazil, Russia, India, China and South Africa) announced what the First World would have never wanted to hear – creation of a new BRICS devel- opment bank to fund global infrastructure projects. The New Development Bank (as they call it) – with a sub- scribed capital of $50 billion divided equally between its five founders and a $100 billion currency reserve pool – is modelled closely to the World Bank and is a direct challenge to the West’s tight grip over global finances. The two financial institutions – World Bank and In- ternational Monetary Fund (IMF) – have almost always, been led by either an American or a European and have constantly denied the developing world’s request for a “say” within these organisations. They have also been ac- cused of attaching unfair terms and conditions to loans to developing economies and imposing bans against grants made to poorer nations. Even experts of Developmental Economics have crit- icised the two institutions for being biased in favour of the developed world. Hence, the New Development Bank is nothing but a consequence of these frustrations developed over a period of time. In fact, the Contingent Reserve Arrangement of $100 billion, a financial safe- ty net similar to IMF, is the developing world’s way of Coz you want to etch those moments forever Manish K. Pandey Editor, IF YOUR MORNING TEA IS INCOMPLETE WITHOUT The Dollar Business Your TV Brand THAT VIEW he recently concluded 6th BRICS Summit in Fortaleza, Brazil was a little different from its previous versions, particularly because of just two reasons. One, the five-nation bloc (which together accounts for about 50% of the world’s population and more than 25% of global GDP) appeared stronger than ever. Two, it openly chal- The two financial institutions have, almost always, been led by either an American or a European and have constantly denied the developing world’s request for a “say” within these organisations For that life changing TRIPSTER journey LETTING YOU ON THE SECRET BEHIND THE WAUGHS, THE CHAPPELS AND THE WOODIES Smart TV has way you see “Your Brand” change the time you to arrived. It’s generation the world. The new A blissful marriage of health and taste Your though, it means millions of dollars of consignements. And a lifetime of trust. Cruising on a cargo ship and weighing in with the freight can be fun. For us There is no fun without safety. Not in this lifetime. diamond Brand Your Airline Brand Diamonds can’t be saying “We have arrived and the West shouldn’t take us lightly”. Interestingly, with a little more funding, partic- ularly from Moscow and Beijing, the new institution has the potential to even make the World Bank look small. Critics argue that China, the world’s second largest economy, could try to assert greater influence over the new development bank to expand its political cloud across the globe. But then, if the Dragon really wants to be in control, it doesn’t need a $100 billion bank. With more $3.3 trillion in forex reserves it has enough mus- cle power to arm-twist foreign influencers and land its yeti foot on some of the biggest territories in the world. [Don’t forget, China holds the largest share of US debt!] The new BRICS development bank is the beginning of the “New World Order” and in literal sense. And in the long run the competition between the two – Developed World and Emerging World – is only going to intensify further. Who will win depends not only where the bal- ance of power tilts, but also who is able to bridge the gap between economic theories and their applications faster. Very interesting times await us. priceless. Your celebrations are. A Your logistics brand diamond can’t sparkle. Your relationship Your bank brand can. Enjoy the most secure banking The banker to evry Indian makes a prom- ise it doesn’t break. The people depicted in this advertisement are Your Bank’s genuine customers. You may be next. Enjoy food. Fine dine. World-class service. Feel pampered. You’re worth every second you spend with us. Be our guest. www.your_airline_brand.com www.your_bank_brand.in Your PSU Brand Your denim brand try’s foreign trade with the overall economic growth. We are there with you from the very WE HELP YOU MAKE YOUR PLAN OF GOING OVERSEAS A SUCCESS! We have a mandate to not just enhance exports from India, but also to integrate the coun- moment you think of setting up a shop outside the country. We are your trusted partner. LOVE. NEED. WANT. You wanted to see the change. We only gave you the power of innovation. With a touch of technology. It’s your idea! Your technology Brand Some sell denims by using half-nude female first grade. It’s the power of Ima‘jean’ation! models dancing in the dead wake of a night. We do it by using shapes you learnt in your Give wings to your dreams with... Let’s pull together and get it done. YOUR SHOE BRAND Walk in style this summer. Footwear for the diva in you... @MK_Pandey www.thedollarbusiness/blogs/manish 96 THE DOLLAR BUSINESS II AUGUST 2014