Download
1 / 43
430 likes | 677 Vues
Cover Story – Wheeling and dealing in auto components.Why the business of auto components exports isn’t about a drive to nowhere.. read more at https://www.thedollarbusiness.com/magazine/archives

E N D
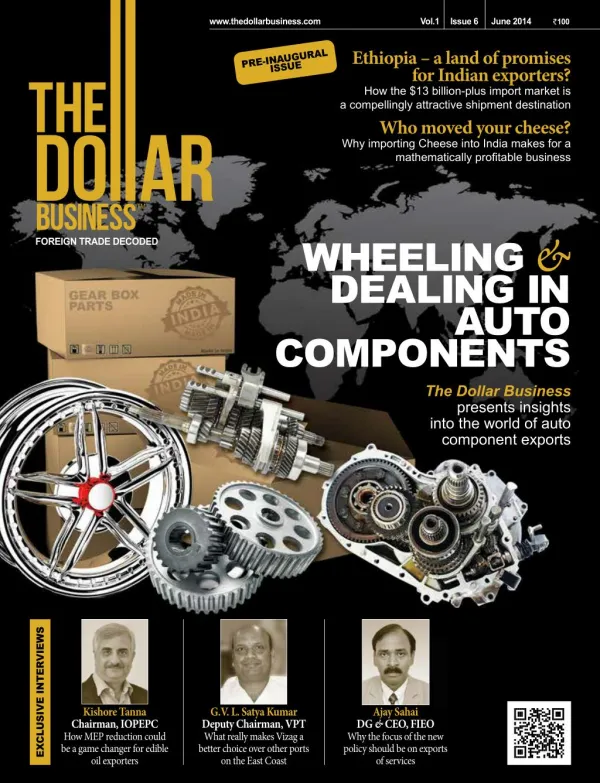
www.thedollarbusiness.com Vol.1 Issue 6 June 2014 100 Ethiopia – a land of promises for Indian exporters? How the $13 billion-plus import market is a compellingly attractive shipment destination Who moved your cheese? Why importing Cheese into India makes for a mathematically profitable business PRE-INAUGURAL ISSUE WHEELING & DEALING IN COMPONENTS The Dollar Business FOREIGN TRADE DECODED AUTO presents insights into the world of auto component exports EXCLUSIVE INTERVIEWS Kishore Tanna Chairman, IOPEPC How MEP reduction could be a game changer for edible oil exporters G.V. L. Satya Kumar Deputy Chairman, VPT What really makes Vizag a better choice over other ports on the East Coast Ajay Sahai DG & CEO, FIEO Why the focus of the new policy should be on exports of services
Your LETTER FROM THE EDITOR–IN–CHIEF though, it means millions of dollars of consignements. And a lifetime of trust. Cruising on a cargo ship and weighing in with the freight can be fun. For us There is no fun without safety. Not in this lifetime. diamond Brand Your Airline Brand Diamonds can’t be priceless. Your celebrations “THE BEATLES”? I SAID “DOLLARS”! are. A Your logistics brand diamond can’t sparkle. Your relationship Your bank brand can. Enjoy the most secure banking T That was the music of the 1960s; your generation won’t understand...” And then would follow his agitated waving of the hand, making me believe each time, that he was there when The Beatles first crossed the Atlantic to get America dance to its tunes. Each time his story starts, I wonder – “How lucky were the four amateurs.” They had no money. Just two years of experience in the show business. And they made a mockery of the likes of domestic greats like CCR, Doors, Elvis and Dylan. They made America choose imported music! 177 million units of their albums were sold in US in seven years. That’s 70,000 units a day (when online shopping was still an unborn brainchild). How The Beatles descended on American culture is an example of how a Liver- pool-born product can make radio stations and television sets come alive from New Jersey to Sacramento! That is as true in the present day as it was half-a-century back. That’s the belief that gave birth to The Dollar Business project. The right product-right market mix can make millions for an exporter or an importer. The Dollar Business be- lieves it can inform and educate those whose guts and minds believe that decoding what appears an encrypted manual on foreign trade is possible. Each issue of The Dollar Business comes with quite a few such million dollar ideas. This issue too does. From importing leather goods to exporting bananas to EU. From earning forex from legal services outsourcing to selling close to $30 million worth of bicycles each year to Africa...the profitable ventures are far too many, and our pages too few. If Indian ex- porters can ship human hair (to 72 countries; earning over $300 million), animal semen (worth $200,000 to US & Vietnam), and natural sand ($7.2 million; 22 markets), there definitely are ‘saner’ exports that can be made to bell prosperity. Foreign trade can be an expensive disappointment. It can prove a bizarre success too. If a hot, tropical market like Brazil can export ‘ski equipment’ to zero-snowfall zones like Angola and the Dominican Republic, there is no reason why you should not fancy a conversation with one of the many-a-saner-business idea that sits quietly inside each issue of The Dollar Business. With hope that the new Foreign Trade Policy will bring good tidings for services and manufacturing sectors alike, with existing incentive schemes being broadened and wrong edges of import tariffs being chipped at, The Dollar Business hopes that its readers become export-and-importomaniacs; some new, some veterans, some diversified. Cross-border trade is a lucrative obsession. It’s no blindfolded stock bet or a meth- odology for just the Dilton Doileys. Every one has a right to fish beyond the pond. The Beatles did too! They became a smash hit. Going back to The Beatles...well, my father still thinks they’re great because they made America love imported music. Bollywood does that to America each day, doesn’t it? How about that for greatness in exports? The banker to evry Indian makes a prom- ise it doesn’t break. The people depicted in this advertisement are Your Bank’s genuine customers. You may be next. hen, he was a scrawny, freshly minted teenager. Scribbling reinvented poet- ry that failed the test of romance, and meditating in the names of then-con- temporary rock bands were acts that made him feel holier-than-thou! To- day, he’s well past 60 and still loves to drown every word that emanates from his half-a-century old birthday gift: a 78 rpm record with the words ‘Rubber Soul’ faintly visible on its label. Ask him what ‘Rubber Soul’ means and he will typically get started thus each time, “Oh! They made America proud of British music. Enjoy food. Fine dine. World-class service. Feel pampered. You’re worth every second you spend with us. Be our guest. www.your_airline_brand.com www.your_bank_brand.in Your PSU Brand Your denim brand try’s foreign trade with the overall economic growth. We are there with you from the very WE HELP YOU MAKE YOUR PLAN OF GOING OVERSEAS A SUCCESS! We have a mandate to not just enhance exports from India, but also to integrate the coun- moment you think of setting up a shop outside the country. We are your trusted partner. LOVE. NEED. WANT. You wanted to see the change. We only gave you the power of innovation. With a touch of technology. It’s your idea! Your technology Brand Some sell denims by using half-nude female first grade. It’s the power of Ima‘jean’ation! models dancing in the dead wake of a night. We do it by using shapes you learnt in your Give wings to your dreams with... Let’s pull together and get it done. YOUR SHOE BRAND Walk in style this summer. Footwear for the diva in you... It’s not for everyone. It’s for the YOU in you. Express Yourself! GO CASHLESS WITH... Your Eyewear Brand How The Beatles descended on American culture is proof of how a Liverpool-born product can make radio stations sets come alive from New Jersey to Sacramento! That’s the belief that gave birth to The Dollar Business project Hit that Wimble- don winning back- hand winner three seconds before noon on a rainy Sunday YOUR BANK mWALLET Your Bag Brand No more going to a cash machine. Now you don’t have to pay those extra bucks at an expensive bureau de change. No more waiting or standing in a queue. It’s the end of cash! Power up your life with ‘Your Bank’ card. It’s freedom, it’s safety... it’s power in your hands. Go cash- less. Go places. Carry your world in style! Coz you want to etch those moments forever IF YOUR MORNING TEA IS INCOMPLETE WITHOUT Your TV Brand THAT VIEW Steven Philip Warner Editor-in-Chief, The Dollar Business steven@thedollarbusiness.com For that life changing TRIPSTER journey LETTING YOU ON THE SECRET BEHIND THE WAUGHS, THE CHAPPELS AND THE WOODIES Smart TV has way you see “Your Brand” change the time you to arrived. It’s generation the world. The new @SPWarner www.thedollarbusiness/blogs/steven A blissful marriage of health and taste JUNE 2014 II THE DOLLAR BUSINESS 1
SPOTLIGHT JAPAN With trade deficit reaching record highs, it’s becoming increasingly clearer that Abe doesn’t have a magic wand 12 Volume: 01 Issue: 06 June 2014 www.thedollarbusiness.com BIG IDEA – ETHIOPIA WHAT? WHERE? WHY? Not many consider Ethiopia an attractive proposition for Indian exporters. Is it true? 14 facebook.com/tdbIndia twitter.com/TheDollarBiz in.linkedin.com/in/thedollarbusiness/ EDITORIAL & RESEARCH Editor-in-Chief: Steven Philip Warner Editor: Manish K. Pandey Executive Editor: Shakti Shankar Patra Deputy Editor (Online): Bidhu Bhushan Palo Senior Editors: Jayashankar Menon, Satyapal Menon Assistant Editor: Sisir Kumar Pradhan Special Correspondent: Neha Dewan Principal Correspondent: Sachin Manawaria Senior Correspondent: Purba Das Editorial Coordinatior: Sayyada Shama Unissa EDITORIAL CONSULTING BOARD Founder Editor: Anil Goyal Publisher: Avnish Goyal Chief Consulting Editor: Dr. A. K. Sengupta (Former Dean, IIFT) BRAND ACTIVATION & RESPONSE Vice-President (North and East): Aninda Mondal CHARTERED TERRITORY PGICA – 2014 All of India’s power woes dissected to the smallest detail 20 ART & PHOTOGRAPHY Art Director: Sujesh Kumar G. Photo Editor: R. Rehman Senior Designer: Chandan Singh Designer: Sonia Kholgade EXCLUSIVE INTERVIEW KISHORE TANNA, CHAIRMAN, IOPEPC How a limit on something as silly as packet size is hampering India’s exports of edible oil 66 THE DOLLAR BUSINESS ONLINE Senior Web Developer: Kiran Kumar Lenka Web Developer: S. Vamshi Krishna Associate (Web & Network): C. Dileep Reddy INFOGRAPHIC TEA A sector which is as recession-proof as anything under the sun 24 COVER STORY 36 CIRCULATION & DISTRIBUTION General Manager: S.S. Sudesh WHEELING AND DEALING IN AUTO COMPONENTS Why the business of auto components exports isn’t about a drive to nowhere... FINANCE & LOGISTICS Manager: Parchuri Jhansi Associate: Raj Jarikote IMPORT’ONOMICS TITANIUM DIOXIDE Colour the world and let the world colour your bank account DOCKYARD VISAKHAPATNAM PORT Fighting increased competition, political wrangling and more... 52 26 PRINTER Kala Jyothi Process Pvt. Ltd., 1-1-60/5, RTC Cross Road, Musheerabad, Hyderabad, Andhra Pradesh 500020, India GLOBAL TRADE – THIS MONTH News, leads and analyses related to glob- al trade during the month of May 04 RENDEZVOUS Ajay Sahai, Director General & CEO, Federation of Indian Exports Organisations (FIEO) POLICY MONITOR Interview of Pradip Thakkar, Vice-Chairman, PLEXCONCIL 60 32 PUBLISHED AT 5-2-198/4, Distillery Road, Ranigunj, Secunderabad, Andhra Pradesh 500003, India © Copyright 2014 No part of this magazine may be reproduced in whole or in part without an ex- pressed permission of the publisher. The information on this magazine is for information purpose only. The Editor-in-Chief & Editor are responsible for the selection of news and content under PRB Act. Vimbri Media Pvt. Ltd. assumes no liability or responsibility for any inaccurate, delayed or incomplete information, or for any actions taken in reliance thereon. The information contained about each individual, event or organisation has been provided by such individual, event organisers or organisation without verification by us. All disputes are subject to exclusive jurisdiction of competent courts and forums in Hyderabad, AP. 76 INSIDE-OUT EU ban on Indian Alphonso mangoes UNLOCKING CASH The ‘Pre-Shipment Export Credit Scheme’ analysed 62 BESTSELLER CHEESE Ever tried to figure out why cheese don’t come cheap? 50 INDIAN TRADE - THIS MONTH Events and occurences of interest to Indian foreign trade enthusiasts 08 80 PRIME FOCUS FDI in retail BORDERLINE The African safari 68 Printed and published by Avnish Goyal for Vimbri Media Pvt. Ltd. Published at 5-2-198/4, Distillery Road, Ranigunj, Secunderabad - 500 003, AP. NEW-GEN NEWSMAKER Anuj Mehta, Co-founder & Director, Pegasus ToyKraft 72 Printed at: Kala Jyothi Process Pvt. Ltd., 1-1-60/5, RTC Cross Roads, Musheerabad, Hyderabad - 500 020, AP. MONOLOUGE PEOPLE SPEAK Highlighting opinions and thoughts of pol- icymakers and think-tanks on global trade and inter-country relationships 11 FOR EDITORIAL/CONTENT QUERIES Email: editorial@thedollarbusiness.com . Tel: +91-40-6677 0766 DATE BOOK Indian and foreign trade fairs you shouldn’t miss 74 FOR ADVERTISEMENT QUERIES Email: ads@thedollarbusiness.com . Tel: +91-40-6677 0765 FOR SUBSCRIPTION QUERIES Email:subscription@thedollarbusiness.com . Tel: +91-40-6677 0765 2 THE DOLLAR BUSINESS II JUNE 2014 JUNE 2014 II THE DOLLAR BUSINESS 3
GLOBAL TRADE THIS MONTH News & Analysis News & Analysis EU-CHINA TRADE DUMPING CHARGES Tables have turned, and how In a major setback to European exporters of Polysilicon, China has im- posed anti-dumping and anti-subsidy duties on the raw material used in the manufacturing of solar panels with effect from May 1, 2014. According to Chinese officials, anti-dumping duties of 42% will be levied on Polysili- con exporters from Germany, Italy and Spain. European companies such as Schmid Group, Joint Solar Silicon, MEMC Electronic Materials SpA and Si- liken Spain are expected to be the primary victims of the new anti-dumping duties. Interestingly, the Chinese authorities have kept Wacker Chemie AG out of the ban list citing the German company’s price commitments for the Chinese market. Further, Polysilicon exporters from Europe would also be subject to 1.2% anti-subsidy duties. China and European Union (EU) have been at loggerheads since 2013 after the latter announced the imposition of anti-dumping duties on so- lar panels made in China. Chinese officials claim that the decision was taken to protect domestic solar panel producers. Notably, China had im- posed similar duties on Polysilicon manufacturers from South Korea and US in January this year. On the other hand, the European Commission has alleged that Chinese companies are flooding European markets with low-cost solar panels which has severely affected local producers. Although the Com- mission had proposed to impose duty on Chinese solar panels, some EU member countries opposed it fearing loss of business and a similar action by Chinese author- ities. Well, they seem to be right! The affected products include fruits, vegetables, flowers, dried fruits, vegetables and juices INDONESIA PROTECTIONISM Eyeing the world’ fourth largest population Polycrystalline silicon, also called Polysilicon, is used as feedstock material in most solar energy applications. Solar panels are shaping up as a major bone of contention between EU and China Governments of United States and New Zealand have written to the WTO requesting a discussion with Indonesia regarding the latter’s re- strictions on import of horticultur- al and animal products. The two countries claim that Indonesia’s de- cision violates the country’s trade commitment under the GATT 1994 agreement on agricultural commodities, particularly import licensing procedures and the agree- ment on pre-shipment inspection. Both US and New Zealand have urged Indonesian authorities to further discuss the matter in order to resolve the issue. UKRAINE-AUSTRALIA TRADE GATT VIOLATION ALLEGED Blowin’ in the wind The Director-General of WTO has constituted a three-member panel to look into complaints filed by Ukraine against Australia’s plain-packaging law for cigarettes and cigars. Two years back, Ukraine had re- quested WTO for consultation with Australia concern- ing certain Australian laws and regulations that impose trademark restrictions and other plain packaging re- quirements on tobacco products and packaging. Ukraine has objected to Australia’s Tobacco Plain Packaging Act 2011 and its implementing Tobacco Plain Packaging Regulations 2011, the Trade Marks Amendment (Tobacco Plain Packaging) Act 2011, and all further regulations, related acts, policies or practic- es that have been adopted by Australia. Ukraine claims that Australia’s measures, especially when viewed in the context of Australia’s comprehensive tobacco reg- ulatory regime, appear to be inconsistent with TRIPS agreement, TBT agreement and the GATT 1994. Proximity to China and India makes Dubai an attractive gold refining destination GOLD MEGA REFINERY IN DUBAI Beginning of the end of London price fixing? The global gold market is heading for interesting times as Kaloti Precious Metals’ $60 million mega gold refinery near Dubai is about to change the dynamics of the industry. To be completed by 2015, it will give traditional gold refiners in Europe and US a run for their money. The new refinery will also give impetus to Dubai Gold & Commodities Exchange’s (DGCX) plan to introduce a spot gold contract in June. Speaking about the new refinery project, Kaloti Precious Metals Chief Executive Tarek El-Mdaka told a news agency that Dubai is already a top global centre for gold trading and the new refinery is part of the process of converting Dubai into a centre for physical gold refining and clearing. Industry insiders feel the new refinery project will help Dubai gain competitive advantage over its European and American coun- terparts because of its proximity to India and China. Moreover, the country’s strong transport network and low taxation system will make it a more attractive gold trading destination than Europe or US. Ukraine claims that three Australian laws are inconsistent with TRIPs and GATT 4 THE DOLLAR BUSINESS II JUNE 2014 JUNE 2014 II THE DOLLAR BUSINESS 5
GLOBAL TRADE THIS MONTH News & Analysis AFRICA BUCKING THE TREND From world’s supplier to an aspiring superpower NATURAL GAS RUSSIA-CHINA DEAL West’s checkmate fails Russia and China have signed a $400 billion deal, as per which Russia will supply natural gas to Chi- na through a new pipeline for the next 30 years. The accord, signed after more than a decade of talks, will allow Russian state-run gas producer OAO Gazprom to invest $55 billion developing giant gas fields in east- ern Siberia and building the pipeline. It’s an ‘epochal event,’ Russian President Vladimir Putin said in Shanghai after the contract was signed. “Both countries are satisfied with the price,” he added. The deal was sealed after Gazprom CEO Alexey Miller and Zhou Jiping, Chairman of China National Petroleum Corporation signed on the dotted line. The agree- ment is for 38 billion cubic meters of gas annually over 30 years. While Gazprom declined to give a price, the company said the total value would be about $400 billion. China may make as much as $25 billion in advance payments under the contract to invest in infrastructure. ALT-CTRL-DEL WINDOWS 8 SUPPORT Dragon shuts down Windows China’s Central Government Procurement Centre (CGPC) has banned the use of Windows 8 for PCs in government offices. The CGPC has issued the notice claiming to further the use of energy-efficient products in government offices. Experts view this as the Chinese government’s effort to ensure data security on PCs. Notably, Microsoft has already announced to stop pro- viding support to Windows XP operating system. CGPC has issued a notice on its website ordering that all computers procured for government use can use any operat- ing system other than Windows 8. According to reports, more than 50% of PCs in China run on XP. The decision to ban Win- dows 8 has come as a major blow to Microsoft, which has been aggressively trying to market Windows 8 as a replacement to XP. In the wake of the shutdown, local industry players have started pushing for a new OS, likely based on Linux or Xinhua. After all, someone’s pain is someone else’s gain! Africa, the so-called Dark Continent, can transform its econo- my and achieve a development breakthrough by participating more effectively in the global production of goods and services. The annual report – African Economic Outlook – by African Development Bank, OECD Development Centre and the Unit- ed Nations Development Programme (UNDP) shows that Af- rica has weathered internal and external shocks and is poised to achieve healthy economic growth rates in the near term. The continent’s growth is projected to accelerate to 4.8% in 2014 and 5-6% in 2015, levels not seen since the global financial crisis of 2008. Africa’s economic growth is more broad-based, argues the report, driven by domestic demand, infrastructure and increased continental trade in manufactured goods. The African Development Bank Chief Economist and Vice-Presi- dent Mthuli Ncube says, “In order to sustain economic growth and ensure that it creates opportunities for all, African coun- tries should continue to rebuild shock absorbers and exercise prudent macro management. Any slackening on macro man- agement will undermine future economic growth.” He is of the view that to achieve strong, sustained and inclusive growth in the medium- to long-term, the opportunity for participating in global value chains should be viewed as part of the overall growth strategy. The report argues that more effective participation in re- gional and global value chains could serve as a springboard for Africa in economic diversification, domestic resource mobil- isation and investments in critical infrastructure. “Now is the time to step up the tempo of economic transformation, so that African economies become more competitive and create more gainful jobs,” the report states. In order to do so, the continent, however, needs to avoid getting stuck in low value-added activ- ities. It’s high time the Dark Continent moves ahead. Vladimir Putin, President, Russia APEC OPEN BOUNDARIES Global trade at, across and behind the border economic innovative development and reform, and facilitate establishment of comprehensive infrastructure and connectivi- ty. The APEC member countries also deliberated on intellectual property rights, services, investment, industry, and regulatory cooperation. The APEC member countries also expressed their support to a forward looking approach on travel facilitation is- sues and the End-to-End review of the APEC Business Travel Card Scheme. They also prepared a blueprint emphasising on regional connectivity to improve trade and investment and cut- ting down on logistics costs across the Asia-Pacific region. An APEC Multi-Year Plan on Infrastructure Development and Investment, to be implemented in 2016, was also discussed at the meet. Priority areas include the showcasing of public-pri- vate partnership infrastructure projects, recommendations for bankable PPP delivery, including legal and regulatory enhance- ments, and the establishment of new PPP centres to promote these arrangements. US-MEXICO TIES MAKING UP FOR LOST TIME Beefing Up US Agriculture Secretary Tom Vilsack recently highlighted the progress made on trade ties between US and Mexico, following a panel discussion with Mexico’s Secretary of Agriculture Enrique Martínez Martínez. The panel was part of the Global Fo- rum on Agro Food Expectations forum in Mexico City. Vilsack’s remarks came as Mexico’s expanded import ruling to allow increased potato imports from US. Mexico also recently announced it would expand American beef imports as well. At the forum, Vilsack joined Martínez and Canada’s Minister of Ag- riculture and Agri-Food, Gerry Ritz, for a panel discussion titled “Integration of Agro-Industrial Markets in North America: Challenges and Opportuni- ties.” The panelists discussed how US, Mexico and Canada can continue to work together to create jobs and economic opportunity for the agricultural industry. “Mexico is an important ally and a partner to US. In recent months, we have made progress on a number of issues that will help increase economic opportunity for both of our countries,” Vilsack said. Member countries of Asia Pacific Economic Cooperation (APEC) have agreed on continuing support for the multilater- al trading system and advancing regional integration through Bogor goals, and Free Trade Area of the Asia Pacific (FTAAP). According to the statement issued by the Trade Ministers of member countries after the conclusion of the two day APEC meeting held in Qingdao, China, a decision was also taken to develop the global value chain, and supply chain connectivity. Further, according to the statement, APEC aims to strengthen regional economic integration by removing impediments to trade and investment ‘at the border’, enhancing supply chain connectivity ‘across the border’ and improving the business en- vironment ‘behind the border.’ Another significant agreement among the member countries was on improving the operating environment for business by reducing the cost of cross-border trade, improving access to trade information and simplifying regulatory and administrative processes. The member coun- tries also expressed support to the multilateral trade negotia- tions underway in the WTO. APEC was of the view that further simplification of customs and immigration procedures, harmonisation of industry reg- ulations and standards, and cutting of administrative costs for things like permits and shipping containers would accelerate the process of multilateral trade among member countries. The focus of the APEC meeting was to develop strategies for improving trade and economic growth across the Asia-Pacif- ic region, to promote regional economic integration, promote Africa: Real GDP growth (%) 7.0- 6.0- 5.0- 4.0- Tom Vilsack, Agriculture Secretary, US 3.0- 2.0- 1.0- 0- 05 06 07 08 09 10 11 12 13* 14** 15** Chinese Minister of Commerce Gao Hucheng (4th L) addresses the APEC trade ministers’ meeting held in Qingdao, China, on May 17, 2014 * Estimated, ** Projected, Source: UNDP 6 THE DOLLAR BUSINESS II JUNE 2014 JUNE 2014 II THE DOLLAR BUSINESS 7
INDIA TRADE THIS MONTH News & Analysis News & Analysis COTTON YARN SURGE IN EXPORTS Dragon plays spoilsport for Indian cotton exporters India’s cotton yarn exports for FY2014 is likely to be 1,350 mil- lion kilograms, valued at $4.70 billion. According to a research conducted by The Cotton Textiles Export Promotion Council (Texprocil), India’s cotton yarn exports are all set to achieve their targets despite impediments such as seasonal fluctua- tions and burgeoning raw cotton prices. In fact, India exported 1,082 million kilograms of cotton yarns, valued at $3.75 billion during the first ten months of FY2014. Thanks to the high qual- ity of Indian yarns, the product is much sought-after globally. However, lately, there is much discomfort in the industry due to the newly announced Chinese Cotton Policy since China is a large importer of cotton and cotton yarns from India. Prices of Indian cotton yarns in China, even after duty and taxes, are still lower than local yarn prices, something that’s not going down well with the Dragon country. Interestingly, China has already reduced its cotton yarn import volumes from India. Tough times ahead for Indian cotton exporters, we would say! Despite being the world’s biggest consumer of whisky, India’s exports are on the rise WHISKY INDIAN EXPORTS RAISE CONCERN Not in favour of the other kind of ‘high’ Indian cotton yarn exports to China 10- 09- 08- Whisky manufacturers of Scotland have vowed to pursue legal action against the ‘extremely worrying’ quantities of cheap Indian blends that are being imported to the EU, posing ‘unfair’ competition to ‘genuine’ producers. The Scotch Whisky Association, which has taken legal action against some of the importing firms over the year, urged EU-wide action on the problem in its 2013 annu- al report released recently. The EU, in 1989, issued strict guidelines to be followed by all whisky manufacturers. The guideline makes it mandatory for the whisky to be distilled from cereals in order to retain the flavour and aroma. The guidelines also make it mandatory for the liquor to be al- lowed to mature for at least three years in wooden casks. In contrast, there are no compulsory definitions of whis- ky in India. “Very little Indian ‘whisky’ qualifies as whisky in the EU owing to the use of molasses or neutral alco- hol, limited maturation (if any) and the use of flavourings. Such spirits are, of course, considerably cheaper to produce than genuine whisky,” the report claimed. Since 2009, the association has learnt that large quantities of such Indian ‘whisky’ is being exported in in bulk into the 28-member EU. Majority of them are mixed with other whiskies and is then sold by supermarkets at extremely low prices. “These products undercut all genuine whiskeys, including Scotch, Bourbon and Irish Whisky. Their sale is unfair competition against genuine ones,” the report added. 07- 06- Workers sorting out chilli and leaving them for drying before they can be packed for exports SAUDI ARABIA BAN ON INDIAN CHILLI Kingdom says no to Indian chilli 05- 04- 03- 02- 01- Saudi Arabia has recently banned Indian chilli peppers, citing the presence of high pesticide residues in them as the main reason. Interestingly, the ban came after EU tem- porarily banned the import of Alphonso mangoes from In- dia on May 1, citing contamination by pests. Chili pepper exports from India to Saudia Arabia have risen three-fold in the last four years and hence this decision comes as a big shock to a large section of exporters. Indian Agricul- tural and Processed Food Products Export Development Authority (APEDA) has urged Indian exporters to com- ply with Saudi Arabia’s import requirements and has asked them to send the produce for testing before they are finally exported. “As a region West Asia is very important to India. We therefore do not want to jeopardise our trade ties with Saudi Arabia or any other nation in the region. Hence, we have advised our members to test export oriented goods carefully before exporting,” an APEDA release said. Indian chilli pepper export to Saudi Arabia 0 FY09 FY10 FY11 FY12 FY13 Source: Commerce Ministry; *All values in million $ 1.4- 1.2- 0.1- 0.8- 0.6- 0.4- 0.2- 0- FY09 FY10 FY11 FY12 FY13 *All values in million US$ Indian cotton yarn exports to China went up three-fold in FY2013 8 THE DOLLAR BUSINESS II JUNE 2014 JUNE 2014 II THE DOLLAR BUSINESS 9
INDIA TRADE THIS MONTH News & Analysis monologue GOLD IMPORTS RBI RELAXES IMPORT RESTRICTIONS Was it just a matter of time...? With increasing criticism of India’s curbs on gold import, it was probably just a matter of time before normalcy was al- lowed back, particularly now that a new government is in power at the Centre. While still just a small step, the Reserve Bank of India, vide a notification on May 21, 2014, has decided to modify the guidelines for import of gold by nominated banks/agencies/entities. These re- vised guidelines which came into force with immediate effect allow Star Trading Houses and Premier Trading which are registered as nominated agencies by the Director General of Foreign Trade (DGFT), to im- port gold under the 20:80 scheme, which was introduced last July to control burgeoning current account deficit, subject to the fol- lowing conditions: a) The STH/PTH should have imported gold prior to the in- troduction of 20:80 scheme. STH/PTH should get the required verification done by the Department of Customs at any port where they have imported gold consignment in the past. b) The first lot of gold under this scheme would be based on the highest monthly import during any of the last 24 months prior to the RBI’s notification dated 14th August, 2013, subject to a maximum of 2,000 kg. c) As in the case of other nominated agencies, the eligible quan- tity may be imported by STH/PTHs from any port, subject to their eligibility limit/maximum quantity allowed to them. d) For proper compliance, before import, they must submit the import plan, port-wise and quantity-wise, to the concerned Customs office, where the verification of the figures of past performance was done. This information will be sent to all the other ports from which imports are permitted. The overall dis- cipline of exporting 20% of each imported consignment before the next consignment is imported will be equally applicable to such STH/PTH importers Further, it has been decided to permit the nominated banks, to give Gold Metal Loans (GML) to domestic jewellers out of the eligible domestic import quota to the extent of GML out- standing in their books as on March 31, 2013. This move is expected to increase India’s monthly average gold import from the current 25-30 MT to about 50-60 MT and also reduce the premium that gold buyers in India end up paying as compared to international prices. While the step is no doubt a welcome one, exclusion of importers who do not fall within the ambit of the definition of STH or PTH (i.e., a minimum of Rs.2,500 crore worth of exports in two out of the last four years by an in- terested party), definitely raises questions on the RBI decision. NATURAL GAS EXPORTS TO INDIA The protectionist side of Uncle Sam A bi-partisan group of 22 US senators have expressed their reservation on the export of natural gas to Asian countries such as India and China. They have argued that such a move by the Obama administration will re- sult in price rise at home. The senators, in a letter to Obama, said that NG price in Asia is currently four times of that in the US. Integration of US and Asian natural gas markets through US exports could lead to further increase in prices for US consumers and busi- nesses. This will fundamentally reverse many of the economic benefits that have led to the current surge in manufacturing jobs growth in US. Further, they argue that large scale export of natural gas to Asia could also jeopardise America’s goal of achieving energy indepen- dence. Really! “We have clearly conveyed that the Government of India will not subject itself to any unilateral investigation by US.” INDIAN COMMERCE SECRETARY RAJEEV KHER REACTING TO THE USTR’S PRIORITY WATCH LIST IN WHICH INDIA FIGURED AMONG COUNTRIES WITH UNSATISFACTORY IPR AND TRADE REGIME “As a middle grounder, South Korea can bridge the distance between developed and underdeveloped countries.” WTO DIRECTOR GENERAL ROBERT AZEVEDO DURING HIS RECENT VISIT TO SOUTH KOREA Houses (STH/PTH), “Although Japan and China have difficult issues, we agreed that we should proceed with cooperation between the two countries based on our mutually beneficial and strategic relationship.” JAPANESE TRADE MINISTER TOSHIMITSU MOTEGI AFTER THE FIRST HIGH-LEVEL MEETING BETWEEN THE TWO NATIONS SINCE SHINZO ABE’S VISIT TO THE YASUKUNI WAR SHRINE LNG exporters to India Qatar Nigeria Egypt Algeria Yemen Rest 5,734.18 715.92 376.00 296.63 246.70 187.01 “THE BIGGEST IMPACT FOR THE GULF COOPERATION COUNCIL WITH MODI HAVING BECOME THE PM OF INDIA WILL BE ON THE TRADE SIDE MORE THAN POLITICS.” M. R. RAGHU, SENIOR VP (RESEARCH), KUWAIT FINANCIAL “EU has treated an important trading ally, which represents a sixth of the population of the globe, with disrespect.”BRITISH MP KEITH VAZ, WHILE REACTING TO EU’S DECISION TO BAN THE IMPORT OF INDIAN ALPHONSO MANGOES Source: Commerce Ministry; All figures for FY2013 (S million) “We haven’t especially commented on sanctions or responded to them harshly, although we could do something unpleasant or offensive to those countries that are introducing these sanctions.” RUSSIAN PRIME MINISTER DMITRY MEDVEDEV REACTING TO WESTERN SANCTIONS CENTRE 10 THE DOLLAR BUSINESS II JUNE 2014 JUNE 2014 II THE DOLLAR BUSINESS 11
SPOTLIGHT JAPAN DOUBLING DOWN ON ABENOMICS Fighting deflation for two decades can wear down the best. Even a Samurai. Undeterred however, the ‘Land of the Rising Sun’ has decided to battle all odds with a ‘Damn the torpedoes’ attitude. A monetary policy that was religion for long, remained religion. But while the devaluation of the yen took Japan’s import bill to the stratosphere, exports barely budged. Its trade deficit is now at a record high. How the samurai spirit seems to have lost its loudness... From being an importer of just raw materials about six years ago, Japan’s is now a net importer of several finished products. A Airport Auto Hub Capital Port Deliberately depreciating one’s domestic currency is not a panacea for all foreign trade- related woes. Japan is a lesson. B Tokyo CHANGE IN JAPAN’S TRADE BALANCE BY TYPE OF GOODS A 300 Other Final consumer goods Final capital goods Intermediate goods (parts) Raw materials Intermediate goods (processed goods) Trade balance Yokohama Yokohama 200 100 (US$ billion) 0 -100 -200 INDO-JAPAN TRADE Although Indo- Japan trade has almost doubled between FY2010 and FY2013, the trade balance continues to be in favour of Japan. Sendai Sendai -300 Exports Imports 14,000.00 -400 Kobe Kobe 2007 12 08 09 10 11 Source: “Trade Statistics” (Ministry of Finace) (Year) 12,000.00 12,412.29 11,999.43 Chiba Chiba 10,000.00 (US$ million) JAPAN’S BALANCE OF PAYMENT *The Dollar Business Intelligence Unit B 9,790.65 8,000.00 8,632.03 Source: Commerce Ministry 300 6,000.00 6,734.08 6,868.58 6,328.54 250 6,100.06 Income balance Trade balance Balance of services Current-account transfers Current-account balance 200 5,091.24 4,000.00 3,629.54 150 (US$ billion) 2,000.00 100 50 0.00 FY10 FY11 FY12 FY13 FY14* -0 Shizuoka (Years) -50 Aichi -100 Source: “Balance of payments” (Ministry of Finace and Bank of Japan) and “Foreign Exchange Rates” (Bank of Japan) Japan is in the advanced stages of negotiating several FTAs. If finalised, it could increase the country’s FTA coverage from 19% to 74%. INDIAN IMPORTS FROM JAPAN INDIAN EXPORTS TO JAPAN -150 India’s primary exports to Japan have been mineral fuels, gems & jewellery, marine products and organic chemicals. Oil meals too are slowly gaining popularity. 2005 06 07 08 09 10 11 12 (Year) US-UE FTA(TTIP) 2,318.90 China-Japan-Korea FTA 4,130.11 (US$ million) 3,648.89 2,461.63 Japan-EU EPA (US$ million) 618.28 343.37 291.11 1,636.78 Pacific Alliance Regional Comprehensive Economic Partnership 346.98 Canada 1,099.42 338.07 EU 1,278.81 Korea Fukuoka Fukuoka US Japan China Trans-Pacific partnership agreement (TPP) India Free Trade Area of the Asia-Pacific ASEAN Nuclear Reactors, Boilers & Machinery Iron and Steel Electrical Machinery & Equipment Ships and Boats Optical and Photographic Goods Other Mineral Fuels Natural or Cultured Pearls Fish and Crustaceans Residues, Waste from Food Industries Organic Chemicals Other Mexico Colombia Source: JETRO Peru Chile Australia / NZ Kagoshima Kagoshima MEGA FTAs IN THE WORLD (NEGOTIATIONS UNDERWAY) Nuclear reactors and allied products are India’s main imports from Japan. India’s imports from the island nation, with which it signed a comprehensive FTA in 2011, increased by over 3% last fiscal. Singapore, Malaysia, Vietnam, and Brunei are involved in TTP negotiations 21 APEC member countries/regions 12 THE DOLLAR BUSINESS II JUNE 2014 JUNE 2014 II THE DOLLAR BUSINESS 13
THE BIG IDEA WHAT? WHERE? WHY? ETHIOPIA – A LAND OF PROMISES FOR INDIAN EXPORTERS? Two Hamer women at a traditional market during a festival dedicated to initiation rite for young men in Dimeka (Omo Valley, Ethiopia) Not many consider Ethiopia an attractive proposition for Indian exporters. Here’s a fact that could change your perception – over 8% of Ethiopia’s imports are from India, and yet the market doesn’t feature in the top 10 export markets for Indian traders in Africa. With potential for a host of consumer durables and non-durables, Indian exporters can take more advantage of what we call the ‘Ethiopian consumer class’ BY DR. A. K. SENGUPTA, CHIEF CONSULTING EDITOR, THE DOLLAR BUSINESSTM 14 THE DOLLAR BUSINESS II JUNE 2014 JUNE 2014 II THE DOLLAR BUSINESS 15
THE BIG IDEA WHAT? WHERE? WHY? Top imports by Ethiopia from India (2013-14) Leading products that will enable Indian exporters to take advantage of a soon -to-become $10 billion export market A) Pharma products; B) Iron & steel; C) Nuclear reactors, boilers & machinery; D) Cereals; E) Plastics; F) Electrical equipment & machinery; G) Rubber & articles; H) Articles of iron and steel; I) Automobiles - 2, 4, multiple-wheeled and accessories; J) Apparel and accessories; K) Printed books and publication material; L) Paper and paperboard; M) Sugar and sugar confectionary; N) Optical inst. - photographic, cinematographic, medical; O) Mineral fuels, oils and by products; P) Organic chemicals; Q) Aliminium and articles; R) Misc. chemical products; S) Man-made staple fibres; T) Tannig or dyeing extracts, paints, inks, putty, etc. Source: #The Dollar Business Intelligence Unit forecast (Moving Average Regression - Trend following analysis); *Ministry of Commerce, GoI Meyazia 27 Square – commonly known as Arat Kilo – is a square in Addis Ababa, the economic and political capital of Ethiopia I Africa, rapid expansion of western trade and investment, political turmoil, etc. In the last few years, this scenario appears to be gradually changing and what lies beyond, seems a palmy time for traders, full of opportunities and promises. Fundamental changes have taken place in Africa in the last two decades. The combined political and economic restructuring has resulted in increased average economic growth rates, a pos- itive growth per capita incomes and a large increase in foreign direct invest- ment (FDI). Ethiopia is an excellent example of how Africa has changed over the last ten years. After a long period of civil war when it had a centralised command economy, Ethiopia is today in a period of peaceful transition. Political restructur- ing has ensured the end of the civil war and an enlightened policy of economic ndia had a glorious history of trade relations with East Africa during ancient times. However, this trade relationship could not flourish due to the process of de-colonisation in East ner in which the country has grown as an export market over the years. Total global exports into the market is sched- uled to reach $10 billion soon, with the potential for Indian exports to rise from the current 8% to much higher levels. At present, Ethiopia imports the highest values of iron & steel, chemicals, fertiliz- ers, textiles, capital goods and consumer durables. Imported capital goods consist of heavy transport vehicles and indus- trial machinery. Major consumer goods imported consist of automobiles and automobile components and parts, food items and pharmaceuticals. On the im- ports side Saudi Arabia, United States of America, Italy and Germany account for about 50% of its total imports. It will not be wrong to say that trade and investment between India and Ethi- opia have been well below potential. Trade has concentrated around limited basket of items. While India imports only traditional items like coffee and leather, Ethiopia imports various manufactured items from India. As the Ethiopian mar- ket is more akin to the Indian market as liberalisation has given prominence to private enterprises, trade and foreign investment. These policies have started attracting foreign investment too. With a population of about 97 million (July 2014 estimates; CIA World Fact- book), Ethiopia is the second most pop- ulous country in Sub-Saharan Africa. It is a nation with great natural resources. It has considerable untapped mineral wealth, fertile land, abundant man pow- er, large water resources and Africa’s largest bovine population. A strategic location gives it access to the markets of East Africa, Europe and the Middle East. This, when combined with member- compared to the OECD markets, there is no reason why trade between the two countries should not diversify and in- clude items which are at present being imported from the OECD countries. Ethiopia’s strategic location and trade agreements also make it an ideal base for re-exports to Europe, USA and markts in the Middle-East. There exists potential for increasing the levels of Ethiopian ex- ports to India by diversifying the basket of goods to include pulses, phosphorus and oil seeds. However, the maximum potential for trade exists in leather, hides and skins. On India’s part, it can export iron & steel, commercial vehicles, chemicals, electrical machinery, pharmaceuticals, cotton yarn & fabrics and bicycles to Ethiopia, and a host of other consumer durables and non-durables which Ethio- pia is importing from other sources. Where lies the sizeable opportunity for Indian exporters to exploit Ethiopia as an export destination, is however a big question. At present, India caters to un- der 6% of the top 20 products that Ethi- ship of Common Market of Eastern and Southern Africa (COMESA) and GSP concessions from USA, makes Ethiopia an ideal base for international trade. Ethiopia’s trade with the rest of the world and India is a reflection of its eco- nomic structure and the global compet- itiveness of its economy. The Ethiopian economy is dominated by the agricultur- al sector; this sector contributes about 50% of the Ethiopian GDP. The level of development of the manufacturing sec- tor in Ethiopia is low; this sector con- tributes about 11% of its GDP. Given the importance of the agricultural sector, this sector is the major contributor to ex- ports from Ethiopia. Agricultural prod- ucts make up about 85% of Ethiopia’s exports. On the other hand as the indus- trial sector is underdeveloped, Ethiopia imports large quantities of capital goods, intermediates, raw materials, spare parts and fuels. IN 2012, INDIA SUPPLIED 1.4% OF CARS, 0.7% OF TRUCKS AND 0.1% OF TELEPHONES IMPORTED BY ETHIOPIA. DISMAL! opia imports (in value terms; 2012; as per researchers at MIT’s Observatory of Economic Complexity). What are these most demanded products by Ethiopian business and retail consumers? They include the following: Refined Petroleum, Wheat, Delivery Trucks, Palm Oil, Mixed Mineral or Chemi- cal Fertilizers, Packaged Medicaments, Large Construction Vehicles, Raw Sug- ar, Raw Iron Bars, Cars, Buses, Rubber Tires, Aircraft Parts, Telephones, Stone Processing Machines, Computers, Ni- trogenous Fertilizers, Synthetic Filament Yarn Woven Fabric, Gas Turbines, and Iron Structures. HOW INDIA MISSED OUT ON LARGE VOLUMES OF WHEAT EXPORTS TO ETHIOPIA LAST YEAR WAS AN ISSUE MUCH DISCUSSED THE BURNING QUESTION What makes Ethiopia an attractive des- tination for Indian exporters is the man- 16 THE DOLLAR BUSINESS II JUNE 2014 JUNE 2014 II THE DOLLAR BUSINESS 17
THE BIG IDEA WHAT? WHERE? WHY? GDP growth forecasted of 7-8% over the next five years (Ethiopia is listed as one of the 26 nations that will record the fast- est growth between 2012 and 2050 as per a report by HSBC) with expectations of a fast rising per capita income (that will grow 400% in the next thirty years from the current $410; as per World Bank and HSBC estimates), a young nation with a median age of 17.6 years and with 64% under the age of 24 – the Ethiopian safari is one instance where it is hard to deny that every investor involved in the race to capture Ethiopia will fail to cash in on the market’s sweetness. India already supplies 73% of sugar demanded by this market. It’s time to make the shipping basket sweeter. Workers at the Port of Berbera: The port, which is classified as a major class port, is situated in the northwest- ern Berbera District of Somalia with its sheltered harbour in the Gulf of Aden. It serves as the main export-import port for Ethiopia, a country that does not have own access to the sea editorial@thedollarbusiness.com Dr. A. K. Sengupta Chief Consulting Editor, The Dollar Business; Former Dean of The Indian Institute of Foreign Trade (IIFT), New Delhi A busy street in Wolaita Sodo, a town and separate district in south-central Ethiopia. The town is among the 18 growth-pole towns identified in the Wolayta zone AND WHAT ARE THE EXACT OPPORTUNITIES? In the case of refined petroleum, India caters to only 1% of Ethiopia’s total de- mand, and in the absence of supply woes, policy hurdles and latent demand, our exports of this product can be raised by over 95 times. There was recently much talk about how India missed out on strong wheat prices caused by crisis in Ukraine, drought in some US wheat-producing regions, season delays in Canada (due to a longer-than-normal cold season) and lower Australian produce due to the El Nino. It could have been missing out on much action in Ethiopia too! India is a country that already has excess of this crop in its coffers. India’s current wheat crop, is currently being harvested, and expectations are that the total output will reach the highest ever for a single sea- son – 96 million tonne. Add that to the 38 million tonne that is already stored away by the government, and there is no reason to believe why exporters from India should miss the opportunity of in- creasing their wheat supply to Ethiopia by anywhere up to 33 times. (At present, India caters to only under 3% of Ethio- pia’s import demand for the cereal crop.) The world hasn’t missed a blink in dis- cussing how the great Indian auto road show is now losing steam. Especially in the passenger cars and commercial ve- hicles categories. What are we blaming? The EU crisis? Slowdown in the Ameri- cas? Elections in Australia? Stop blaming the PIGS, and start counting how many buses and cars domestic and multina- tional auto companies from India fell short of when it came to supplying auto- mobiles. In 2012, India supplied 1.44% of cars, 3.68% of buses, and a paltry 0.74% of trucks imported by Ethiopia. Is there scope to make more money from exports to Ethiopia? [Waiting for an answer?!] Isn’t it surprising that India (with so many domestic cellphone producers) ex- ports only 0.07% of telephones imported by Ethiopia. With a strong manufactur- ing base, where it exports about $1.5 bil- lion worth of aircraft parts to the world, it doesn’t pay attention to the $90 million plus demand in Ethiopia. Packaged and unpackaged medicaments and medical instruments, large construction vehicles, stone processing machines, and even gas turbines (of which India supplies noth- ing!) – count the products and their count keeps on rising, there are reasons aplenty for Indian exporters to bet bigger on the Ethiopian market in days to come. For exporters looking at longer term and a bigger picture, investing in Ethio- pia could also be an option. For Ethio- pia to be able to integrate and assimilate foreign investment into its economy, the levels of technology and capital in- tensiveness should be appropriate for a developing economy. India’s long expe- rience in developing appropriate tech- nology and in the promotion of small industries could be used by Ethiopia, keeping the above objective in mind. Opportunities for foreign investment in Ethiopia abound in the areas of miner- al extraction, agro-based industries and light manufacturing. Indian business- es can invest either individually or as a consortium in areas like infrastructure development and mineral extraction. Smaller units can be set up to tap op- portunities in areas like leather & leather manufactures and food processing. With well-chosen product categories, Indian exporters will find that getting an epic blend of products to cajole buyers in Ethiopia isn’t too difficult an exercise. A Demand-supply gap analysis: Indian exporters – Ethiopian importers Supply gaps that India could look to fill in product categories that are imported (in large volumes) by Ethiopia S.No 1 2 3 4 5 6 7 8 9 10 11 12 13 14 15 16 17 18 19 20 Commodity Refined Petroleum Wheat Delivery Trucks Palm Oil Mixed Mineral or Chemical Fertilizers Packaged Medicaments Large Construction Vehicles Raw Sugar Raw Iron Bars Cars Buses Rubber Tires Aircraft Parts Telephones Stone Processing Machines Computers Nitrogenous Fertilizers Synthetic Filament Yarn Woven Fabric Gas Turbines Iron Structures Imports ($million) Demand - world Supply Gap Supply Gap (value) # 1,400.75 1,386.19 369.49 358.60 298.38 296.16 276.92 276.89 233.98 233.33 184.24 141.50 168.71 160.03 168.49 45.72 163.93 156.17 149.87 147.71 103.37 99.57 93.65 78.25 90.80 90.80 90.11 90.05 88.19 85.51 86.74 82.34 81.55 81.01 79.88 76.19 75.98 75.98 68.32 57.59 From the India From the Demand - Enhancement factor (1x) for (%) # Indian exporters # 98.96% 97.05% 99.26% 99.99% 99.72% 76.80% 94.85% 27.14% 95.27% 98.56% 96.32% 83.56% 100.00% 99.93% 96.96% 94.93% 99.34% 95.38% 100.00% 84.29% 14.56 10.89 2.22 0.026 0.65 42.74 8.68 122.77 7.76 2.16 3.8 15.4 95.21 32.93 133.41 10,649.59 358.97 3.31 18.44 0.37 20.13 68.38 26.20 5.08 N/A 0 0.065 2.68 4.4 0.54 3.69 1,385.33 31.91 18.71 150.01 20.65 AT PRESENT, INDIA CATERS TO UNDER 6% OF THE TOP 20 PRODUCTS THAT ETHIOPIA IMPORTS (IN VALUE TERMS) 0 N/A 5.37 10.73 Source: #The Dollar Business Intelligence Unit; Data source: MIT- OEC (2012) Note: Enhancement factor is the number of times Indian export value has to be raised, in the absence of policy restrictions and latent demand, from the current levels to meet total demand of the destination market (Ethiopia) 18 THE DOLLAR BUSINESS II JUNE 2014 JUNE 2014 II THE DOLLAR BUSINESS 19
CHARTED TERRITORY POWER-GEN INDIA & CENTRAL ASIA 2014 SOLVING THE POWER PUZZLE Glimpses of Power Gen India and Central Asia trade fair and conference, held at Pragati Maidan in New Delhi between May 5 and May 7, 2014 It’s not for no reason that electricity features amongst the top three demands of the Indian electorate – electricity, roads and water. And with India’s peak power deficit at just 3-4%, it’s disappointing that a majority in India don’t have access to quality power. The Dollar BusinessTM was in attendance at the 13th PGICA convention, where all stakeholders of the power sector presented innovative ideas and technologies that can help solve India’s power puzzle BY NEHA DEWAN T India, saw a packed house in attendance. Nearly 7,000 delegates and attendees from over 60 countries made it to the event. Over 100 speakers from different countries presented strategic and techni- cal sessions, highlighting key challenges, opportunities and the regulatory frame- work in play in the power sector. And it all augured well with 40% ex- hibitors rebooking for the next edition of PGICA. “This year we saw 20% more bookings as against last year, with fur- ther interest generated for next year as well! The maximum queries and interest was generated regarding dealership and equipment procurement in the power sector,” Avnish Seth, Project Head, PGI- CA told The Dollar Business. Spread over a three days in the capi- tal and covering a multitude of issues, the sessions on the first day centred on ‘Electricity’s role in promoting India’s continued economic growth.’ Policy and regulatory concerns moderated by P. D. Sudhakar, Chairman, Delhi Electricity Regulatory Commission (DERC) India, were among the strategic sessions held on the same day. The Electricity Act of 2003 also came up for discussion which, it was felt, had not fulfilled its promises. V. L. Sonavane, Member – Techni- cal, Maharashtra Electricity Regulatory Commission, shed light on some of the key concerns as well as the solutions at hand for regulators. Delving on the need for better regulation to facilitate development of ‘Smart Grid’ in India, he said, “Smart meter, smart analytics and smart people are the three main pillars of success. Regulatory effectiveness can be exercised by minimising influence of state government and regional regula- tors offering possible solutions.” Second- ing Sonavane’s thoughts, Ella Coulson, Marketing Coordinator at PennWell, one of the co-organisers, said that Smart Grid – a technology used on electricity networks right from power plants and wind farms to electricity in homes and he 13th annual Power-Gen In- dia and Central Asia (PGICA), co-located with Renewable En- ergy World India, DistribuTech India and incorporating HydroVision SMART METER, SMART ANALYTICS AND SMART PEOPLE ARE THE PILLARS OF SUCCESS OF SMART GRID IN INDIA 20 THE DOLLAR BUSINESS II JUNE 2014 JUNE 2014 II THE DOLLAR BUSINESS 21
CHARTED TERRITORY POWER-GEN INDIA & CENTRAL ASIA 2014 businesses – can help in reducing the rural-urban divide to a great extent. “This event is primarily an initiative to tap India’s potential future growth in the power sector. Another main objective is to find ways through which the rural-ur- ban gap can be reduced,” she added. This year a new module – Distribu- Tech India – offered further insight by addressing issues related to transmission and distribution of power in India and other markets. Besides automation tech- nologies & market policies, an engaging session was tabled on the significance of cyber security in modern digital sub-sta- tions and the cyber security implications of IT/OT convergence in smart utilities. Speakers from companies such as IBM, Infosys, Tata Power Trading, Lanco Pow- er and many others, presented key facts and solutions that could help facilitate distribution of power in a better manner. Over 250 exhibitors, including local and international companies, participat- ed in PGICA this year, showcasing rele- vant products and technology. Distribu- tion and conservation systems, boilers and steam systems, material handling systems, plant electrical systems and pumps were among a host of products and services that were exhibited at this DECODING FOREIGN TRADE! Various exhibitors showcasing their products and technologies at PGICA 2014 A final wrap on ‘Integration of Re- newables on the Grid – Opportunities and Challenges’ concluded the event on the last day for the Renewable Energy and DistribuTech India sessions, with an emphasis on power quality improve- ment as well as convergence of renew- able energy from conventional energies in industries. At the same time, PGICA presented various discussions on power plant safety techniques that addressed design technology as well as application of Vibration Isolation Systems (VIS) for power plant machines. Around the same time next year, the ‘power’ buzz will de- scend on India’s financial capital and is expected to be a bigger hit. According to Seth of PGICA, “The interest from the industry seems to be only growing with each passing year.” year’s event. The forum was also seen as the perfect opportunity to network with prospective local partners for setting up business in the country. While speaking to The Dol- lar Business, Jan Soukup, Commercial Director for Reko Cooling Towers, an international construction and design company dealing in construction, repair and service of cooling towers, said “We are keen to have some presence in the In- dian market via a local partner. We have already contacted some people. There is a big potential for construction of power units in India. We want to be a part of this growth”. The three-day conference also featured a plethora of sessions per- taining to renewable energy, in which speakers discussed the significance of achieving India’s solar energy potential, rural electrification across the country and India’s bio-energy sector. OVER 250 EXHIBITORS PARTICIPATED IN PGCIA THIS YEAR, SHOWCASING INNOVATIVE PRODUCTS AND TECHNOLOGY neha@thedollarbusiness.com 22 THE DOLLAR BUSINESS II JUNE 2014
Assam Valley 531.26 INFOGRAPHICS TEA A B C TEA PRODUCERS DESTINATION FOR INDIAN TEA Darjeeling 9.02 Source: ITC Annual Bulletin 800.38 62.45 Dooars 147.59 158.00 Supplement 2012 Srilanka-304.49 Call it tea, tee, te, tae or chai, chay, ceai or caj. Cherish it cold like the Americans, spice it up like the Kashmiris or Tibetans, or just gulp it down presuming it to play the druid’s concoction. Irrespective of name and usage, it is globally the most popular beverage. Originating in China and popularised around the world by the Portuguese and the British, quite naturally, tea has transcended all national boundaries – by people’s habits, by people’s trades! 326.28 368.2 Kenya-430.21 China-321.79 Vietnam-135 India-201.08 Terai 112.82 Rest Rest ( million KG) (primarily Germany, Pakistan and Australia) Vietnam Sri Lanka LARGEST TEA PRODUCING REGIONS IN INDIA (Production in million kg. in FY2013) Kenya MAJOR EXPORTERS Kazakhstan Source: Commerce Ministry Source: ITC Annual Bulletin India Iran (million KG) U.A.E U.K China All figures for FY13 (million KG) Russia Supplement 2012 127.06 1761.00 1111.76 101.34 Cachar 50.00 73.78 369.56 95.43 INDIAN TEA EXPORTS D E INDIAN TEA PRICES Tamil Nadu 162.79 900 828.29 811.89 140 800 707.16 707.58 120 700 Price per KG in INR 100 600 *The Dollar Business Intelligence Unit 598.21 (US$ million) ONE FOR THE ‘TEA’TOTALERS 42.95* BLACK TEA DUST IN BULK 53.02* 566.60* BLACK TEA LEAF IN BULK 80 500 Source: Commerce Ministry 60 400 Source: Tea Board Kerala 61.62 300 40 200 20 100 0 FY06 FY07 FY08 FY09 FY10 FY11 FY12 Karnataka 5.46 0 North India Avg. Price South India Avg. Price FY10 FY11 FY12 FY13 FY14* (Year) India continues to be the 2nd largest tea producer in the world after China. However, over 70% of its tea is consumed domestically. A Tea exports from India increased (y-o-y) by 1.88 million kg. in FY2013 to 216.23 million kg. About 25% of India’s tea exports went to Russia and Kazakhstan in FY2013. B Tea was introduced into Kenya from India by a European settler G. W. Caine in the 19th century. Today Kenya is the world’s largest producer and exporter of black tea. C BLACK TEA IN PACKETS The premium that North Indian tea commands over the South Indian variety has been rising over the last few years. D Despite massive domestic demand, tea exports from India has steadily risen over the years.The reason for a drop in FY2014 was simply the fall in the value of the rupee. E INDIA MOSTLY EXPORTS BLACK TEA IN VARIOUS FORMS, BUT LATELY, GREEN TEA EXPORTS HAVE RISEN 81.38* OTHER BLACK TEA 14.13* GREEN TEA 63.20* REST *EXPORTS FROM INDIA IN FY2013 ($ MILLION) Women plucking green tea leaves at a plantation in Mitoyo Kagawa, Japan. Green tea is an integral part of the Japanese way of life, with about 95% of the green tea produced in Japan being consumed domestically 24 THE DOLLAR BUSINESS II JUNE 2014 JUNE 2014 II THE DOLLAR BUSINESS 25
IMPORT’ONOMICS TITANIUM DIOXIDE COLOUR THE WORLD, FATTEN THE WALLET S been called the City of Pearls of Sweat! But for S. Y. Gangadhar, owner of a small paint manufacturing unit in Am- berpet area of the city and Chairman of the Indian Small Scale Paint Association (Andhra Pradesh), this summer is dif- ferent. With his daughter’s wedding just days away, Gangadhar doesn’t have the luxury to discuss the weather or the elec- tion results for that matter. He is a very busy man, shuttling between wedding shopping and his modest manufactur- ing unit. What has brought a smile to his face though is the plethora of options, at various price ranges, that are available in the market for almost everything – from invitation cards to grains of rice. How he wishes such options were available to him when he is out shopping for raw ma- terials for his paint business! INCREDIBLE INDIA Paint is a raw material intensive in- dustry. For every rupee of sales, paint manufacturers spend about 60 paise on raw materials. Apart from several petro- leum-based raw materials, the industry consumes Titanium Dioxide (TiO2) in a very big way. In fact, TiO2 accounts for about 25% to 30% of the total raw ma- terials consumed by a paint manufac- turer. Although estimates suggest that India has one of the largest deposits of ilmenite and rutile, which are used for the commercial production of TiO2, it is heavily dependent on imports. The trend was not always like this though. A decade ago, India was a net exporter of TiO2 (see chart titled: Imports and ex- ports of Titanium Dioxide by India) – a fact almost forgotten by a large section of even industry insiders. But while de- mand grew manifold in the last decade, domestic production failed to keep pace, resulting in increased dependence on imports. And with not much of capaci- ummer is when Hyderabad gets an embarrassing addition to its nickname. With the mercury consistently soaring into the 40s in April, May and June, the city has lately It’s the mother’s milk of the $5 billion Indian paint industry. But with very little domestic production and no major investment lined up, Titanium Dioxide imports are all set to skyrocket once the economy is back on track. What should be music to the ears of any prospective importer though is the fact that potential margins are substantial BY SHAKTI SHANKAR PATRA 26 THE DOLLAR BUSINESS II JUNE 2014 JUNE 2014 II THE DOLLAR BUSINESS 27
IMPORT’ONOMICS TITANIUM DIOXIDE Profitability estimate of TiO2 imports Cost of TiO2 (CNY/MT) * Cost of TiO2 (USD/MT) ** Freight & Insurance (USD/MT) # CIF Landing Charge LC (1%) CIF + LC Import Duty ID (10%) CIF + LC + ID Countervailing Duty CVD (12%) ID + CVD Cess (0.7%) 2 CIF + LC + ID + CVD + Cess Additional Countervailing Duty ACD (4%) Final Cost Final Cost (INR/MT) Retail Price in India # Profit Annual Profit Margin (Percentage) ^ * Rutile produced by Luohe Xingmao in Henan, China ** Assuming USDCNY exchange rate of 6.2 # The Dollar Business Intelligence Unit ^ Assuming a fortnightly cycle 12,500.00 2,016.13 70.00 2,086.13 20.86 2,106.99 210.70 2,317.69 278.12 488.82 3.42 2,599.23 103.97 2,703.20 1,62,192.19 1,65,000.00 2,807.81 CHINA HAS CONSISTENTLY BEEN THE BIGGEST EXPORTER OF TIO2 TO INDIA, ACCOUNTING FOR CLOSE TO 30% OF INDIA’S IMPORTS OF THE POPULAR 41.54 PIGMENT discolouration under ultra-violet light, is thermally stable, non-flammable and non-toxic. Because of a unique blend of these qualities, it has gained wide ac- ceptance as a pigment across the globe. Other than the paint industry, which consumes about 60% of the total TiO2 produced globally, it is also extensively used in the production of plastic, paper, ink, rubber, certain pharmaceuticals and cosmetics. In fact, TiO2 is now being increasingly used as a tattoo pigment as well. DESPITE BEING HOME TO ONE OF THE WORLD’S LARGEST DEPOSITS OF ILMENITE AND RUTILE, INDIA HAS BEEN A NET IMPORTER OF TIO2 FOR THE LAST EIGHT YEARS The paint industry in India was growing at double-digits for most of the last decade. However, the recent slowdown has not only affected sales but have also taken a big toll on the margins of paint manufacturers doesn’t get this sense while talking to end users. This is particularly surprising since most accept that Chinese TiO2 is substantially cheaper (sometimes as high as 35%) as compared to its western coun- terparts. Speaking to The Dollar Business, S. K. Mishra, General Manager (R&D), Shalimar Paints says, “We mostly pro- cure TiO2 from DuPont and Cristal Global but occasionally buy it from local producers like Kerala Minerals & Met- als.” Other than inferior quality, a poor supply chain is one of the main reasons why we don’t use Chinese TiO2, Mish- ra adds when asked for the reasons for his aversion to China. “They just don’t show up,” he further adds. However, the recent economic slow- down and the plunge in the Indian ru- pee has forced many end users of TiO2 Global and Huntsman Corporation. As compared to this, the only prominent Indian producer of the popular pigment is Kollam-based Kerala Minerals & Met- als and a few very small operators like the BSE-listed Kilburn Chemicals. Add to this the fact that Indian demand for TiO2 is expected to grow at a CAGR of 8% to 9% and it becomes very clear that the dependence on imports is only going to rise over the next few years. CHINESE CONUNDRUM A peculiar aspect of India’s TiO2 im- ports is the fact that virtually none of the end users are open about their use of Chinese imports. This, when China has consistently remained at the top of the list of countries from which India imports TiO2. But for reasons, which probably stem more from prejudice, one Country-wise TiO2 imports: FY2005 vs. FY2014 DAVID AND GOLIATH The $60 billion market cap behemoth DuPont E I De Nemours & Co., popular- ly known as just DuPont, is by far the big- gest producer of TiO2 in the world. With production facilities at Altamira in Mex- ico, DeLisle in Mississippi, Edgemoor in Delaware, Johnsonville in Tennessee and Kuan Yin in Taiwan, DuPont com- mands a 20% global market share of the white pigment. Among other major TiO2 producers are Kronos Worldwide, with multiple production facilities in Germany and Western Europe; Tronox, with facilities in US, South Africa and Australia; the Saudi Arabia based Cristal ty expansion planned in the near term, this trend is only likely to get stronger. At the same time, with rising dependence on imports, TiO2 producers from varied geographies are now tapping the Indian market. Countries like the Czech Repub- lic, South Korea and Ukraine, nowhere in the scene 10 years back, are now among the top countries from which India imports TiO2 (see chart titled: Country-wise TiO2 imports: FY2005 vs. FY2014). TiO2 is a naturally occurring oxide of titanium, with a refractive index sec- ond only to diamond. It is resistant to FY2005 FY2014 China Taiwan Germany 3.62 2.33 2.89 China Czech R. Germany South Korea 6.06 9.03 2.79 7.48 Malaysia USA Rest 1.46 4.07 3.72 Ukraine USA Rest 3.16 3.32 6.54 Source: Commerce Ministry; All values in $ million 28 THE DOLLAR BUSINESS II JUNE 2014 JUNE 2014 II THE DOLLAR BUSINESS 29
IMPORT’ONOMICS TITANIUM DIOXIDE About us and re-investment of the corpus, annual margins turn out to be 40% and higher. Profit margins in the anatase grade TiO2, used in interior paints, is roughly at the same levels as the rutile variety. Al- though there are a few anti-dumping is- sues with the anatase grade of TiO2 orig- inating out of China, the reference price set by the customs department are so low that they hardly come into the picture for any serious importer of TiO2. What makes TiO2 imports from Chi- na even more lucrative is the fact that the renminbi, after continuously appre- ciating against the US dollar for most parts of the last four year, has started de- preciating again. In fact, since the start of 2014, the USDCNY has moved from close to 6 to about 6.25. While geopoliti- cal reasons for this are many, the fact re- mains that this trend reversal will make Chinese imports to India even more lu- crative going forward. As for Gangadhar, after realising that the difference in quality of TiO2 between western and Chinese brands has significantly eroded in the recent past, he has vowed to ignore cynics and give Chinese brands a re-look. “I will try to convince other members of my association and may be one day, all of us will collectively import TiO2 directly from China,” he tells The Dol- lar Business with a grin while holding a fancy China-made invitation card in one hand. gang Group. But this hasn’t stopped the Chinese juggernaut. According to esti- mates, 29% of TiO2 nameplate capaci- ty is now based in China, as compared to just 13% in 2005. When it comes to incremental supply, China’s dominance stands out even more. As per estimates, more than 60% of the incremental supply in the next few years will come from Chi- na. Companies like the Shandong-based Shandong Doguide Group, which claims to be Asia’s largest producer of TiO2, Henan-based Luohe Xingmao and Jiang- su-based Wuxi Haopu Titanium are at the forefront of this tectonic shift, which will see close to a million metric tonne of fresh capacity in China. As compared to this, the total capacity addition in the rest of the world is expected to be just 350,000 metric tonnes. “THE QUALITY OF TIO2 PRODUCED IN CHINA HAS IMPROVED SIGNIFICANTLY AND MOST MAJOR INDIAN PAINT MANUFACTURERS HAVE INCREASED THE USE OF IT” The vision behind ‘The Dollar Business’ is to become the most desired destination of information on foreign trade in the country! Description The journey of The Dollar Business has wonderfully begun. It belongs to the house of Vimbri Media Pvt. Ltd., a media company headquartered in Hyderabad. The Dollar Business is an India-based magazine for India-based exporters and importers – and the so-called, multinational giants – that believe in the magic of trade beyond borders. There are many business magazines in the country that claim to be ‘essential’ reads. They have many-a-claim to fame – usually without much reason or proof, like being number one in India across many dimensions. How uninteresting. The Dollar Business doesn’t claim to be number one. It’s the only one in India. And it doesn’t know many dimensions. Just one – global trade! to look towards China, or at least come out in the open about their use of it. This, since the difference in prices between western TiO2 and comparative grades produced in China, continue to remain too high to ignore – particularly in a re- cessionary economy. Another reason for India’s rising imports of TiO2 from Chi- na is the remarkable improvement in its quality. Speaking to The Dollar Business, Ramakanth V. Akula, former President of Indian Paints Association says, “Over the last 3-4 years, even the large paint manufacturers in India are increasingly using TiO2 imported from China. While pricing has got to do a lot with this new trend, a marked improvement in the quality of Chinese TiO2, has made the case for it more compelling.” He expects the Indian paint industry to continue to grow in the high teens – the rate at which it grew between 2002 and 2012 – and be- lieves the slowdown in the last couple of years was an aberration. When asked if he expects any changes in the duty struc- ture for imports from China after the formation of a new government, he says, “We just don’t produce enough TiO2 in this country. Most large paint manufac- turers import about 90% of the TiO2 they use. It would be suicidal to hike du- ties on imports.” MARGIN CALL Various rutile grades of TiO2, used in exterior paints, are currently being quot- ed by Chinese first-line manufacturers in the 12,000 – 12,600 CNY/MT range. Assuming a USDCNY rate of 6.2, a US- DINR rate of 60, freight and insurance cost of $70/MT and applicable duties, the final cost for an importer in India adds up to anything between Rs.1,55,922/ MT and Rs.1,63,446/MT. This, at a time when it is being retailed in Indian for about Rs.1,65,000/MT, thereby provid- ing a profit margin in the range of 1.7- 1.8% per shipment. Since, TiO2 is a very fast moving commodity, even assuming just a couple of shipments per month From an industry that records a turnover of close to 10 times of India’s GDP each year, there is much to be learnt. Actually, there much to earn too! The Dollar Business™ has a focused reach. We don’t cater to the everyday Toms who want to flip pages to catch a glimpse of Marilyn Monroe or read what a novice has heard through the grapevine about some business going bust. Our content isn’t priceless in that respect. Our readers desire serious information that either supports their case or gives them an understanding that can be priced. Our readers are either stakeholders in the business of export-import, or have a keen interest in what this indus- try has to offer. Like we say, we just know one dimension – global trade, and most definitely, all our readers have a serious interest in both our articles and the advertisers. To cater to such a focused reader group, we don’t just do with everyday content creators and field reporters who know little about the vast subject of foreign trade. We have content specialists on board who have dealt with foreign trade as a platform for decades. This expert editorial panel functions pan-India – from the financial capital of India (Mumbai) to the political capital (Delhi), from the Silicon Valley of India (Hyderabad) to the former capital of British India (Kolkata). In fact, the next time you sit sipping Darjeeling tea, there is a chance that we actu- ally would have a fat-glassed analyst roaming the sloped hills where tender apical tea shoots are being plucked. His task – to make our reader something more than just a tea-sipper. How about…a tea exporter with a turnover of a few crore rupees? Excited? shakti@thedollarbusiness.com Imports and exports of Titanium Dioxide by India Exports Imports THE EPICENTER As is the case with most Chinese prod- ucts, TiO2 produced by firms based in China has always been seen with suspi- cion. Things got worse recently when a US jury convicted a California-based businessman of selling DuPont’s TiO2 trade secret to China’s state-owned Pan- Source: Commerce Ministry; *The Dollar Business Intelligence Unit 30 THE DOLLAR BUSINESS II JUNE 2014
BESTSELLER CHEESE WHO MOVED YOUR CHEESE? INDIANS ARE NOW BECOMING SLIGHTLY MORE ADVENTUROUS WITH THEIR CHEESE AS INTERNATIONAL CUISINES GAIN POPULARITY IN THE COUNTRY HEMANT OBEROI, GRAND EXECUTIVE CHEF, THE TAJ MAHAL PALACE HOTEL, MUMBAI It’s the symbol of happiness, celebration and even that million-dollar smile. Those who love the taste of it think it’s heaven on sandwich – from kids to the elderly. Even the poor mouse lurking in your living room falls for the cheesy bait. While the local variety of cheese is consumed in great volumes in India, the imported variety is increasingly finding space in our kitchen shelves. Better news – it’s a lucrative business! I cheese blocks are known to be the envy of even grown-ups. But if you thought no one cares which part of the world the cheese came from – Italy, France, Neth- erlands, Switzerland or good old Guja- rat – you couldn’t be more wrong! Ask Anita, a New-Delhi based marketing professional working for a top MNC and mother of a 16-year-old, who ensures her refrigerator never runs out of ‘high quality’ cheese. “My son is not content consuming local cheese. He is used to his Philadelphia Cream Cheese and Ched- dar blocks. So a steady stock is needed at home all the time, else the entire house will be on fire,” she tells The Dollar Busi- ness with a chuckle. Indeed! Be it the popular and more semi-hard, semi-soft and soft depending on the moisture content and ripening methods. Harder cheese that include Cheddar and Parmesan typically have a lower moisture content and are seasoned for a longer duration. The semi-hard ones are slightly firmer and can be a bit salty in taste. The semi-soft cheese has higher moisture content, at times even BY NEHA DEWAN t’s up for grabs, or so you would think, when you observe the frenzy of activity around cheese stacks in modern retail stores on a bustling weekend. Shopping carts stocked with known varieties of Gouda, Feta and Cheddar or the relatively lesser known Gruyere, Camembert and Brie – all these neatly labelled packets of imported cheese vanish from the shelves of super- markets in a jiffy, with customers across age groups, having their pick. Sourced from some of the top international mar- kets, its consumption is not just limited to the affluent. In fact, increasing aware- ness and accessibility have made even the middle class reach out to this market, making the overall imported cheese mar- ket grow at a steady rate of 30% y-o-y. According to a report by management consulting firm Technopak, gourmet cheese, along with olive oil, have made significant inroads into the Indian mar- ket. The market, as per the report, grew from 1,200 MT in FY2011 to 1,600 MT in FY2012. And the momentum continues. Cheese is spread over categories of hard, Profit estimate of cheese imports Cost of Cheese (GBP/Quintal) * Cost of Cheese (USD/Quintal)** Freight & Insurance (USD/Quintal) *** CIF Landing Charge LC (1%) CIF + LC Import Duty ID (30%) CIF + LC +ID Countervailing Duty CVD (0%) ID + CVD Cess (0.9%) CIF + LC + ID + CVD + Cess Additional Countervailing Duty ACD (4%) Final Cost Final Cost (INR) # Retail Price in India *** Profit Profit Margin (%) 865.00 1,453.20 425.00 1,878.20 1.88 1,880.08 564.02 2,444.10 --- 564.02 5.08 2,449.18 97.97 2,547.14 1,52,828.70 2,00,000.00 47,171.30 THE ‘IMPORTED’ TAG IS GOOD ENOUGH TO PLAY UP ON THE INDIAN PSYCHE 30.87 *Wholesale Price of Danish Blue Cheese in Denmark ** At a GBP/USD rate of 1.58 *** TDB Research # At a USD/INR rate of 60; does not include Selling, Gen. & Admin. costs 32 THE DOLLAR BUSINESS II JUNE 2014 JUNE 2014 II THE DOLLAR BUSINESS 33
BESTSELLER CHEESE Source of India’s Cheese imports Types of Cheese India imports THERE ARE OVER 2,000 VARIETIES OF CHEESE 288.53 Italy 106.7 UK 174.88 Netherland 310.07 Denmark 200.02 France 213.49 Rest 214.94 Fresh Cheese 35.74 Grated or Powdered Cheese 563.24 Processed Cheese Not Grated 479.77 Other Cheese REMAINS OF CHEESE HAVE BEEN FOUND IN EGYPTIAN TOMBS OVER 4,000 YEARS OLD IN 1869, ENGLISH CHEESE MAKERS GREEN’S OF GLASTONBURY MADE AND GAVE BRITISH QUEEN VICTORIA A WED- DING GIFT OF A GIANT 1/2 TON CHEDDAR WHEEL A loaf of Feta cheese, which is primarily produced in Greece, Turkey and Balkan states. The EU has passed legislation restricting the usage of the word ‘Feta’ Source: Commerce Ministry; All figures in tonnes for FY2013 Source: Commerce Ministry; All figures in tonnes for FY2013 as high as 60%; the moisture smoothens its texture base. The semi-soft varieties of Halloumi cheese from Cyprus, and Ha- varti, originally from Denmark, are very popular among consumers. Soft cheese varieties – French Brie and Camembert – are creamier with a high percentage of water. These varieties of cheese have a short shelf life, and, have to be consumed within two months after production. Denmark (followed by Netherlands and Italy), has been the top country for sourcing bulk quantities of imported cheese into India in FY2013 and FY2014. Denmark, with its array of Danish Blue and Blue Castello cheese, attracted enough consumption, with 111,000 kg of cheese being imported in FY2014 as against 268,000 kg the previous year. Netherlands, famous for its Gouda cheese, followed next with approxi- mately 72,000 kg imported last fiscal as against 126,000 kg the previous year. Retail prices in India for cheese vary and vary quite a bit. While Holland Gou- da is priced at Rs.1,500/kg, Goat Gou- da is available at Rs.1,200/kg. Emborg White Feta, imported by Dabon Inter- national, is priced at Rs.499 per 200 gm, while Cheddar slices sell at Rs.295 per 200 gm at some of the leading modern retail stores. Delhi-based Modern Bazaar with its branches across the city, for instance, positions its imported food as the USP of the store. Among cheese, stocks of the Greek Classic Feta, Swiss cheese, soft cheese such as Ricotta and Brie, semi- hard varieties of Gouda and Provolo- ne as well as the distinctive blue mold cheese, either soft or firm, can be seen available in good quantities. Further analysis of the operations and logistics of the gourmet cheese market in India indicated that profit margins for vendors supplying cheese in bulk quantities to restaurants, hotels and other food chains are substantial. According to sources, vendors keep a margin anywhere between 10-15%, after working out custom duties, freight tariffs and other costs. Most hospitality chains procure from vendors and pay a higher price for the product. They reason that they have little choice. “The elasticity, texture and taste of imported cheese is all very different from the ones made in India. We have to keep 12-15 varieties of imported cheese for our clients, even if costs are high. These are consumed by both Indian as well as international cli- ents,” Avinash Handoo, Executive Chef at India Grill, a multi-cuisine restaurant at Hilton Garden Inn (New Delhi), tells The Dollar Business. The hospitality play- er uses some of the best varieties to cater to the demand – Italian cheese such as Buffalo Mozzarella, Mascarpone, Parmi- giano Reggiano, Mediterranean Cheese like Feta Greek and Feta cubes as well as the popular Cheddar blocks from Northern Europe, besides a host of oth- ers. No wonder it has customised cheese dishes on its menu, with Cheese Fondue, Grilled Halloumi and Cheese Dynamites being the most popular. And it’s not as if Indians are restrict- ing themselves to the more known va- rieties of Cheddar, Mozzarella or Feta. As Hemant Oberoi, Corporate Chef and Grand Executive Chef, The Taj Mahal Palace Hotel (Mumbai), while speaking to The Dollar Business, puts it, “Indians are now becoming slightly more adven- turous with their cheese with interna- tional cuisine becoming more popular. Varieties like goat cheese, camembert and brie are quickly becoming top choic- es.” Most of the imported cheese at the hotel is from Italy, France or Switzerland, with some of the prominent types being Gruyere, Camembert, Feta and Parme- san. In addition to hospitality chains, a bulk of imported cheese finds its way to THE TERMS “BIG WHEEL” AND “BIG CHEESE” ORIGINALLY REFERRED TO THOSE WHO WERE WEALTHY ENOUGH TO PURCHASE A WHOLE WHEEL OF CHEESE THE AVERAGE AMERICAN EATS 32 LB (14.5 KG) OF CHEESE EACH YEAR Various categories of cheese on display at a shop in Delft, Holland: India imported close to 175 MT of cheese from Holland in FY2013 stand alone restaurants, fast food outlets as well as leading retail stores. But cheese importers have their issues. High import duties leads to additional costs that gets passed on to consumers. Result – consumption of cheese becomes restricted to metros and Tier-2 cities. Inappropriate storage and preserva- tion facilities, in addition to their high costs are problems too. The supply chain and infrastructure bottlenecks only com- pound delays, costs and wastages. Inad- equate cold-storage equipped transport facilities also pose a huge challenge in this segment. The cold chain framework, with the supply-demand mismatch is a big obstacle. cheese varieties seeking shelf space to cater to the burgeoning demand. The fu- ture, looks bright for importers. Interestingly, some psychological fac- tors act as a bonus to the business. “The ‘imported’ tag is good enough to play up on the Indian psyche. The moment such labels are seen by shoppers, there is an image in their mind that says ‘good buy’. Such a mindset, obviously, boosts sales and is good for imported food products, including cheese,” says a cheese produc- er, who did not wish to be named. Turns out, selling cheese at non-cheesy profit margins is exciting business. Food chains have their own grievanc- es to share. “For a hotel the number one challenge when it comes to cheese would be storage. Different varieties of cheese require different methods of storage, in order to ensure that it retains its essence. Apart from this most varieties of cheese have an extremely short shelf life,” adds Oberoi of The Taj Mahal Palace. Others lament the delays in customs clearance (that have occurred in recent times) that lead to hotels ordering bulk quantities and stocking material way be- forehand. However, despite many-a-challenge, the gourmet cheese market in India is poised for growth with more imported THE ELASTICITY, TEXTURE AND TASTE OF IMPORTED CHEESE IS ALL VERY DIFFERENT FROM THE ONES MADE IN INDIA. WE HAVE TO KEEP 12-15 VARIETIES OF IMPORTED CHEESE FOR OUR CLIENTS, EVEN IF COSTS ARE HIGH AVINASH HANDOO, EXECUTIVE CHEF AT INDIA GRILL neha@thedollarbusiness.com 34 THE DOLLAR BUSINESS II JUNE 2014 JUNE 2014 II THE DOLLAR BUSINESS 35
COVER FEATURE AUTO COMPONENTS THE DOLLAR BUSINESS BUREAU With a purpose of giving you insights into the world of auto component exports, The Dollar Business sweat details of the business with CEOs of many businesses and experts. Profits were discussed. Markets were evaluated. Innovations were praised. Policies were debated. And products were zeroed-in on. Interviews and many-an-analyses later, we arrived at one conclusive suggestion for exporters on this dockyard – play big or snooze on. Turns out, auto component exports isn’t about a drive to nowhere PROSPERITY COMES IN PARTS TOO! Yellow robots welding cars in a pro- duction line. Robots are fast replacing humans on shop floors of Indian auto component manufacturers. Such effi- ciencies and improved quality levels will only make India a more powerful manufacturing and export hub 36 THE DOLLAR BUSINESS II JUNE 2014 JUNE 2014 II THE DOLLAR BUSINESS 37
COVER FEATURE AUTO COMPONENTS Auto component industry exports (turnover) 30 30 25 20 Y=1.1929x +1.5 R2 =0.8558 15 12 10 9.3 8.5 5.2 5 4.0 3.8 3.4 0 2014-15* 2015-16* 2016-17* 2017-18* 2018-19* 2019-20* 2020-21* 2010-11 2007-08 2008-09 2009-10 2011-12 2012-13 2013-14 Source: ACMA ; The Dollar Business estimates (Figures for financial - April to March; * Estimates) *The Dollar Business Intelligence Unit has hedged itself against myopic overop- timism in a particular market. One rea- son perhaps why beneath the veneer of calm (unlike his industry peers), Nalin is more excited a marketer today. Another observation. The more mod- est cousin in the automobile family seems to have arrived, having proved in recent quarters why it’s worth some attention. Especially when automobile sales isn’t at its peak. Going by how auto component exporters are rejoicing (auto component exports from India almost touched the $10 billion mark in CY2013), this seg- ment of the autombile market appears to be growing into a more lucrative busi- ness by the day. In high speed. OEMs ARE NOW LOOKING AT STRONG BONDS WITH COMPONENT SUPPLIERS Avtovaz factory, Togliatti, Russia: Besides being a manufacturing powerhouse, the Russian Federation is also a huge consumer market for automotives. It offers great opportunities for Indian auto component exporters H close to a decade in the world of automo- biles, has also seen another American gi- ant fall and rise. When we caught up with Nalin at his Jasola office in New Delhi, he was as we described earlier: “calm”. And why not? 2012 was the year when sales in the Indian auto market was projected to reach levels never touched before. In CY2012, Hyundai India (HMIL) recorded domestic sales of 391,276 units (a rise of 4.7% y-o-y). What came as a bonus for Hyundai was that it had in- creased its lead in the exports category as well. Despite slowdown hitting its major export markets, its shipments climbed “A higher export-domestic ratio makes for more profits,” says B. M. Jain, CMD of TCML, while speaking to The Dollar Business. Jain’s company dedicates in excess of 20% of its auto component capacity to exports and says he makes neat net margins of anywhere between 10-15% from selling in foreign lands. For a realistic him, his focus lies where his the earnings are. And he can’t be more truthful when he says, “Our com- ponent exports can be classified into two sub-categories – high-tech parts and af- termarket parts. Aftermarket parts are more lucrative compared to high-tech parts as far as net margins is concerned.” R. Seal, CEO, Walia Auto Ancillaries Pvt. Ltd. echoes Jain’s voice when he tells The Dollar Business that, “Auto com- ponent manufactures with a higher ex- port-domestic ratio certainly make more profits!” At present, Seal’s company is yundai India’s group head of marketing, Nalin Kapoor, is a calm, dynamic marketer. He’s been associated with the company for over six years now – and in shipments did grow, but only because there was a boost from the two-and three-wheeled categories. Four-wheel- ers grew just modestly. Describing the nightmare of a year, the Federation of Automobile Dealers Associations (FADA) said, “The downturn during the year 2013 was the worst the auto market had ever witnessed. The slowdown was all-pervasive cutting across segments…” In the present day, car exporters are working harder than ever. The same can be said about sellers in the domestic market. But much can be learnt from a player like Hyundai India, who despite a quiet year has continued betting on the exports table. The company still ships 40% of its India production to overseas markets like EU, Africa, Middle East, Latin America, Australia and APAC re- gion. And given this focus on exports, 3.12% y-o-y to 250,005 units. During our hour-long interaction, the light blue shirt and dark blue suit- clad Nalin used words like “exports” and “global campaign”. We discussed Hyundai’s products, marketing strate- gy, consumers, technology, rebranding, and its attention to markets like US. We even discussed how 2013 could become “a difficult year” for Hyundai and its in- dustry peers, and how in general “the years ahead are expected to be tougher than those that went by”. In response, he spoke about how his company was striv- ing to “give the same experience to the user sitting in North America, Europe or India,” while at the same time confessing that “there are some localisation issues that need to be taken care of in India”. He was perhaps hinting at the big man- ufacturing ballgame in markets beyond the pond. Then, 2013 happened. Rather, it crashed upon those involved in the game of cashing-in on the automobile industry in India. For the first time in over a de- cade, demand in the Indian auto market shrunk by 9.59% (to 1.81 million units as per The Society of Indian Automo- bile Manufacturers, SIAM). Barring two players – Hyundai and Maruti Suzuki – other major car manufacturers failed to script a growth tale. Exports ran on a slower track. Auto TIME FOR A BONANZA It might sound like the only word that bridges the words “auto component” and “bonanza” is “exports”. You’re think- ing right. And thinking big. We don’t say it. Experts at global management consulting firm A.T. Kearney do. And so do the many auto component exporters, who are enjoying margins that in the present weather (marred with inflation, rising input costs and not so happily earning customers) are literally incredible. A HIGHER EXPORT- DOMESTIC RATIO MAKES FOR MORE PROFITS 38 THE DOLLAR BUSINESS II JUNE 2014 JUNE 2014 II THE DOLLAR BUSINESS 39
COVER FEATURE AUTO COMPONENTS Export destinations of auto components (2012-13) Source: ACMA (Figures for financial - April to March) nine months leading to December 2013, of which the company’s share stood at 45%!]. The factory employs over 5,300 workers today and is the largest manu- facturer of steering systems in India. Just outside the main factory area, we noticed heaps of finished products. When ques- tioned, the factory manager told us that, “These will be shipped overseas soon…” [“How soon?” was a question that struck us given how the products we thrown in the open, and piled one on another as if the purpose was to touch the moon and back!] To cut a long story short – our conversation with the very serious and seasoned Sunjay Kapur, Vice-Chairman & MD, Sona Koyo Steering Systems, led us to believe that whether it be ex- perimenting with a new category like off-road vehicles or farm equipment, aerospace or defence, he will continue to serve foreign markets. In fact, his first tie-up for his new experiment (off-road vehicle component-making) is with a US company and Kapur expects to start shipping his products very soon. And BRAZIL, INDONESIA AND AFRICA ARE ‘FRESH’ SWEET SPOTS FOR INDIAN AUTO COMPONENT EXPORTERS Car production line with unfinished cars in a row. Global light vehicle sales is recovering after the crisis – much faster than expected! eyeing a market like Indonesia and other untapped and lesser-tapped markets in Latin America. He dedicates 25% of his production volumes to exports and earns net margins of over 10% on average from overseas markets. Call it a difference of philosophy, but unlike TCML’s Jain, his bet is on high-tech parts. Hemachandra Shrotri is currently the CEO of Sunny Engineers, a fast emerg- ing player in the field of auto component exports. Being a tier-2 supplier, his faith is in the potential of markets like Brazil and Czech Republic (two markets where the Indian government has given an in- centive like MLFP Scheme to exporters, besides offering a duty drawback ad- vantage). Listen to him and your appre- hensions about auto component exports vapourise: “Overall, net margins are higher in export business. There is high risk, but if the right market and mix is chosen, export margins are easily 5-10% higher than margins obtained on domes- tic sales.” Shrotri currently makes a net profit of 15% on his exports to the two markets of Germany and US. And like Walia Auto, one-fourth of his company’s production is meant for markets beyond the Indian Standard Time zone. A.T. Kearney’s new report titled, ‘In- dia’s auto component suppliers: New frontiers in growth’, states how OEMs are looking at strong bonds with auto component suppliers with a global sup- ply chain capability. It complains: “Only a small number of Indian auto compo- nent makers focus on exports or conduct business on a global scale, even as future survival and growth in this market re- quire doing both!” At present, an alarm- ing 64% of India auto component suppli- ers export less than 10% of their produce. And only a small percentage (14%) have more than 20% of their product volumes exported! According to what the experts say, with automakers looking at suppli- ers with a global supply chain capability, localised component sellers could (and would) go out of business in a few years from now. Surgically put, “It will be diffi- cult for OEM procurement teams to get approval for introducing a local supplier without global reach.” Thankfully, a player like Sona Koyo realised this some years back. It’s leading an easy life now. A typical day at the Sona Koyo Steer- ing Systems’ manufacturing plant (lo- cated on National Highway 8 between Delhi and Jaipur, spread over an area of close to 15,000 square metre) reflects this fact. When we walked into the facil- ity last spring, we came across a hand- ful of blue-collared employees busy at umpteen assembly lines that roll out steering wheels for all types of passen- ger and commercial vehicles. [India ex- ported steering systems worth Rs.144.12 crore in 2012 and Rs.124.54 crore in the stick he will to component making! Air- craft wings could be next on cards. But one thing’s for sure – he’ll never sell an aircraft! Why sell a house when shipping bricks is easier and there’s money to be made in loads? Especially when you have total profits from exports rising by 46.3% in a matter of a year (in FY2012-13)! ON TOP GEAR It’s not easy to talk about high profit and growth games at a time when the year gone by has proved the slowest in terms of growth (in half-a-decade) for an in- dustry. We’re talking about FY2012-13 and the auto component industry. Still there is confidence in the air. And we dare say, there’s no better time than now. Today Indian auto components are exported to more than 160 countries. Revenues have been growing at 17% year-on-year over the past 5 years and currently account for 24% of the in- dustry’s total turnover. Even the glob- al economic headwinds now seems to have slowed down. As per the latest IMF economic forecast, the world economy Market catered to by Indian auto component exporters Source: ACMA (Figures for financial - April to March) Automotive transmission gear box. Gear box is the largest auto component sub-category bought and sold by importers and exporters from nations across the world 40 THE DOLLAR BUSINESS II JUNE 2014 JUNE 2014 II THE DOLLAR BUSINESS 41
COVER FEATURE AUTO COMPONENTS Top 5 auto component sub-categories exported from India is poised to grow 3.6% and 3.9% in 2014 and 2015 respectively, as against 2.2% and 2.4% in 2012 and 2013 respectively. WTO’s global trade growth forecast of 4.7% in 2014 (2013: 2.1%) is also wel- come news for Indian exports. In fact, the green shoots are now clearly visible. While ICRA does not expect operating margins of auto component manufac- turers to deteriorate much in FY2013- 14 and FY2014-15 vis-à-vis FY2012-13, Mumbai-based brokerage Prabhudas Lilladher expects ancillary companies to post a growth of 15.7% year-on-year in FY2013-14, mainly due to higher reali- sation in the export markets and strong traction in European operations. Exports of auto components offer huge value if past trends are anything to go by. A February 2014 study titled ‘India’s Automotive Industry: Necessary steps on our way to global excellence’ by industry body ASSOCHAM and strate- gy consultants Roland Berger states that since CY2000, Indian auto components suppliers have continuously outper- formed global suppliers on every indi- cator. While the EBITA (earnings before interest, tax, depreciation and amortiza- tion) margins of foreign suppliers have ranged from 8% to 11.5%, the same for Indian suppliers have stayed between 11.5% and 14.5%. ROCE (return on cap- ital employed) for Indian suppliers too have remained on the higher side be- tween 15% and 25%, as against a maxi- mum of 13% of foreign suppliers. Further, while global players are still struggling to hold their grounds, Indi- an players seem to have moved ahead in time. Despite experiencing a weak demand from domestic OEMs, export volume growth has enabled players like Amara Raja Batteries, Bharat Forge, Exide Industries, Motherson Sumi Sys- tems, Balkrishna Industries to clock-in better net margins over the last fiscal (FY2013-14) – 16.9%, 17.8%, 13.5%, 9.5% and 24.7% in FY2014 as against 15.8%, 13.9%, 13%, 7.6% and 20.8% in the previous year (FY2012-13) respec- tively. Profits there certainly are, and in two-digit percentages. 180,000.00 180,000.00 160,000.00 160,000.00 Figures in Rupees Lakhs 140,000.00 140,000.00 Figures in Rupes Lakhs 120,000.00 120,000.00 100,000.00 100,000.00 80,000.00 80,000.00 60,000.00 60,000.00 40,000.00 40,000.00 20,000.00 20,000.00 0.00 0.00 FY FY FY FY FY FY FY FY FY FY 2012-13 2013-14* 2012-13 2013-14* 2012-13 2013-14* 2012-13 2013-14* 2012-13 2013-14* GEAR BOXES BUMPERS DRIVE AXLES MOUNTED BRAKE LININGS SUSPENSION SHOCK ABSORBERS 2012-13 - 122,394.85 2013-14 - 178,881.07 Growth(E) - 46.15% 2012-13 - 109003.70 2013-14 - 137427.78 Growth(E) - 26.07% 2012-13 - 75,487.17 2013-14 - 114,417.33 Growth(E) - 51.57% 2012-13 - 61,901.56 2013-14 - 77,179.53 Growth(E) - 24.68% 2012-13 - 43,574.91 2013-14 - 55,922.11 Growth(E) - 28.34% Source: Ministry of Commerce & Industry; *The Dollar Business Intelligence Unit ries have shown a healthy growth in ex- ports in FY2013-14, categories such as transmission shaft and cranks, gear box- es, drive axles, mounted brake linings, suspensions, starter motors, generators, bumpers, et al, have been the real value drivers for exporters. In fact, gear boxes and bumpers have been front-runners when it comes to exports of auto compo- nents from India in terms of value. Indian manufacturers exported gear boxes worth $329.17 million in CY2013 (source: UN Comtrade) making it their favourite export component in terms of value. [The Dollar Business Intelligence Unit estimates it to top the exports chart in FY2013-14, with a remarkable growth of 46.15% y-o-y.] Simple reason: better margins. The Dollar Business conducted a study on some leading gear box man- ufacturers and exporters in India and found that the average of their last five years’ net profit margins ranged between 9.5% and 15.88%. Bumpers too are not far behind. With $245.80 million worth of bumpers ex- ported in FY2013, this component is no.2 on the popularity chart. [For FY2013-14, The Dollar Business Intelli- gence Unit projects the category to grow by 26.07%.] A study conducted on lead- ers and exporters from nations across the world – gear boxes. In 2013, the to- tal value of gear boxes imported globally amounted to $53.03 billion (Sources: UN Statistics and World Trade Daily). How much of this huge demand was catered to by India? Hold your breath: under 1% (just 0.91% to be dead precise)! Clearly Indian exporters need to quickly evaluate the economics of the huge opportunities that importing na- tions present. If you go by what the United States, Canada, Germany, United Kingdom, Brazil, France, Japan, Spain, Belgium and Turkey – the largest im- porters of this product globally – have to promise, the story of lost opportunities and underperformance by Indian gear box exporters reads the same. In 2012, India supplied only 0.41% of gear box- es imported by US (in value terms). The same stood at 0% for Canada, 0.01% for Germany, 0.14% for UK, 2.64% for Bra- zil, 0.01% for France, 0.28% for Japan, 0.01% for Spain, 0% for Belgium, and 1.82% for Turkey. Not to be confused as an act of patting ourselves at the back, but India did fairly well to maximise business from markets like Thailand and Brazil to cross the $50 million ex- port revenue-mark from each market. ing bumper exporters in India revealed that the average of their last five years’ net profit margins ranged from 12.56% to 17.60%. True. You can’t bet on everything. But you can certainly bet smart in a pok- er game when the “Flop” gives you a straight flush, and if we reveal the “Turn” and the “River” much before the hand is dealt. And we already have. Haven’t we? Workers assembles cars at Fiat Cars Serbia factory in Kragujevac. Russia is the largest car market in Europe and accounts for about 2% of the worldwide production MFN import duty rates (2012): Top importers of Gear boxes EXPORT DESTINATION USA China EU Canada Mexico EXPORTING NATION INDIA JAPAN GERMANY 2.50% 2.50% 8.86%* 9.00%* 3.88%* 3.88%* 3.00% 3.00% 1.11%* 1.11%* USA ‘AWAY’ MARKET GAMES India has been a textbook example of how to create buzz through wheeling and dealing in auto components. Reviews of progress on the export front do seem en- couraging. Yet there is much proof that Indian component exporters have left much to luck and less to strategy. Espe- cially when it comes to closing-in on the demand-supply gaps in various markets. Consider the largest auto component sub-category bought and sold by import- 2.50% 8.86%* 3.88%* 3.00% 1.11%* – 9.00%* 3.88%* 3.00% 1.11%* *Data for 2011 / Sources: WTO and UN Comtrade MFN import duty rates (2012): Top importers of Gear boxes from India EXPORT DESTINATION Thailand Argentina Mexico EU Brazil EXPORTING NATION INDIA JAPAN GERMANY 30.00%* 30.00%* 16.00% 16.00% 1.11%* 1.11%* 3.88%* 3.88%* 16.67% 16.67% USA 30.00%* 16.00% 1.11%* 3.88%* 16.67% 30.00%* 15.00% 1.11%* 3.88%* 16.67% EXPORT MARGINS ARE 5-10 % HIGHER THAN MARGINS ON DOMESTIC SALES CAN’T BET ON ALL CARDS Although all major component catego- *Data for 2011 / Sources: WTO and UN Comtrade 42 THE DOLLAR BUSINESS II JUNE 2014 JUNE 2014 II THE DOLLAR BUSINESS 43
COVER FEATURE AUTO COMPONENTS However, when viewed in toto, India catered to supplying just 0.43% of the total imports of the world’s top ten gear box importing nations. Not a forward moving case study that makes for Indian exporters. There are factors like bilateral trade treaties and cost advantages of various importing nations that act as a deter- rent to India’s export capabilities in this respect. But there are also pro-export policy initiatives – viz. Export Promo- tion Capital Goods (EPCG) Scheme that allows auto ancillary manufacturers and exporters to import capital goods at zero duty, Focus Market Scheme that gives exporters of all products to 125 markets around the world (including 31 in Latin America, 52 in Africa, 10 in Common- wealth of Independent States, 5 in East- ern Europe and 27 in Asia; specified in ta- bles 1 and 2 of Appendix 37C of HBPv1, FTP 2009-14) an entitlement for Duty Credit Scrip equal to 3% of FOB value of gear boxes exported, a Special Focus Market Scheme that gives an additional 1% Duty Credit Scrip for exports to 50 markets (including 12 in Latin America, 31 in Africa, and 7 in Commonwealth of Independent States; specified in ta- ble 3 of Appendix 37C of HBPv1, FTP 2009-14), Duty Drawback Scheme (1.7% Xenophobia? No more... Automotive enthusiasts and experts claim there cannot be a better time for Indian auto components exporters. We agree with them when we see Indian players clocking double-digit growth rates at a time when global players are struggling to stay afloat. But we don’t side with them when they say these play- ers are making the most of it. Still, India caters to just about 1% of the total glob- al demand for auto components. In fact, gear boxes and bumpers – the highest selling components globally – clearly explain the other side of the growth story. Indian players supply just 0.43% and 3.77% of gear boxes and bumpers (by value) imported by the top ten importing nations of these products. What is handicapping India’s export capabilities? Is it the tariff structure of these top importing nations? Or, is it sheer complacency on the part of Indian exporters? The Dollar Business Intelligence Unit compared the duty structures of US, China, EU, Canada and Mexico – the largest importers of gear boxes globally – and found that import duties levied by these nations on gear boxes imported from India were almost equal to duties levied on gear boxes from Japan, Ger- many and US – the three largest exporters of gear boxes globally. Similar was the case in Thailand, Argentina, Mexico, European Union and Brazil – the five largest importers of gear boxes from India (see chart). The story isn’t different when it comes to bumpers. Import tariffs in US, EU, Singapore, Russia and Chi- na – the biggest importers – are not different for bumper exports from India and the three largest exporters globally i.e. Japan, Germany and US (see chart). If this is the scenario, Indian exporters certainly need to go back to the draw- ing boards and conceive strategies that better their performance. A strong out- sourcing tailwind in times to come could be useful. While many companies are shifting production base or sourcing from China – as costs climb in the dragon nation – to more cost-effective destinations, manufacturers from developed countries like Japan, EU, etc., are eyeing low-cost sourcing havens. The new Foreign Trade Policy (2014-19) can perhaps be kinder to auto com- ponent maufacturers as far as incentives and tax sops are concerned. The min- imum value addition limit can be reduced from the current 15% levels (Advance Authorisation scheme) and export liabilities under the EPCG scheme can be relaxed (from the current 8x levels) so as to ensure a more free-willed partic- ipation of players. For instance, in Thailand, to encourage auto components export from the current levels, in addition to incentives provided by the Ministry of Finance, the government has decided to give its own incentives to the auto component industry – including zero export requirements (for duty-free import of capital goods), no minimum local value-addition requirements, etc. The new FTP can also take a lesson from what the Malaysian government recently did to encourage auto component exports and manufacturing using a fresh injection of incentives from the new National Automotive Policy (NAP). The new policy is a mix of duty exemptions (like extension of excise duties and import taxes exemptions for both CKDs and EEVs) and customised incentives for both FDI and domestic investors (such as Pioneer Status, Investment Tax Allowance, Grants for R&D and training, infrastructure facilitation, etc.). Indian policymakers too could work out something attractive in the new FTP to encour- age the creation of a competitive auto-components export hub. According to a report (‘Driving out of uncertain times) by Deloitte, world pro- duction of auto components is expected to reach $1.7 trillion by 2015. And of this $1.7 trillion, about $700 billion worth of auto components will be sourced from low cost countries by 2016. If India targets just 10% share of this lucrative pie, it would mean $70 billion, nearly five times the current size of the industry in India. The pleasures of foreign demand, as we call it. Fiat Cars Serbia factory in Kragujevac: Despite an incentive like Market Linked Focus Product Scheme given by the Indian government, auto component exporters from India cater to only 0.01% of Russia’s imports of gear boxes (CY2013) ABOUT HALF A BILLION DOLLAR WORTH OF GEAR BOXES AND BUMPERS ARE EXPORTED BY INDIA EACH YEAR money from added margins is a fact hard to understand. In these favoured export destinations, India doesn’t seem to be making monster moves. For instance, think of each of these markets specified in the MLFP Scheme. Exporters from In- dia aren’t looking to sweat it out. In 2013, India supplied just 2.64% of Brazil’s im- ports of gear boxes, 0.09% of China’s 0.28% of Japan’s, 4.52% of South Africa’s, 0.25% of South Korea’s and a negligible 0.01% of Russia’s. India doesn’t account for more than 5% of gear box imported by EU27. And how about Czech Re- public’s shipments? Here’s information that shows how the exporting commu- nity doesn’t always get it right. While the Czech Republic imported gear box- es worth $868.65 million in 2013, India supplied just $928 worth of gear boxes to the country! We’re serious. Are exporters in India just being pes- simistic about their export estimates? Or are they not aware of the opportunities that lies in many-a-market overseas? The answer to the second question ob- viously is an easy one. There is a fraction of this exporting society that has a fair idea of how to deal with harsh, unhelp- ful foreign tides – one that has been on a high (tide) in recent months, with all the murmur about rupee volatility, gold and stock markets doing the rounds. There’s a stereotype in the exporting community that subtlety has no place in risk-laden and cumbersome lands. Here you either play big or back out. There are markets. And there is the exporting community that is throwing big chips on the table. Argentina, Columbia, Su- dan (4% Duty Credit Scrip under FMS; excluding other exemptions) and Nige- ria, Kenya, Lithuania (3% Duty Credit Scrip under FMS; excluding other ex- emptions), etc., are some select geogra- phies where Indian gear-box exporters have made big inroads, and today cater to a credible share of the market’s overall import needs (between 3%-40%). New entrants in the business of gear box ex- ports have an option to side with these very emerging markets or to earn from markets that Indian gear box exporters haven’t served too faithfully. [Ed’s note: Which markets? Go back four paras and you get the proper nouns.] Flaccid fundamentals doesn’t seem an option in the second-largest traded auto component segment either – bumpers. Good news. [Globally, brakes and parts are the second-highest selling category. World trade in this category amounted to $20 billion in 2013. In India howev- of FOB value of exports) and Market Linked Focus Product (MLFP) Scheme that provides for an export incentive of 2% of FOB value of gear box exports (in free foreign exchange) from India to markets like Brazil, Japan, South Africa, South Korea, Iran, China, Czech Repub- lic, Russia and 27 countries in EU (refer Table 2, Appendix 37D, HBPv1, FTP 2009-14). How Indian exporters of this prod- uct are resisting temptations of making 44 THE DOLLAR BUSINESS II JUNE 2014 JUNE 2014 II THE DOLLAR BUSINESS 45
COVER FEATURE AUTO COMPONENTS MFN tariff rates (2012): Top importers of Bumpers EXPORT DESTINATION USA EU Singapore Russia China EXPORTING NATION INDIA JAPAN GERMANY 2.50%* 2.50%* 3.75% 3.83%* 0.00% 0.00% NA NA 10.00%* 9.59%* USA 2.50%* – – 3.83%* 0.00% 0.00% NA 10.00%* NA 10.00%* *Data for 2011 / Sources: WTO and UN Comtrade MFN tariff rates (2012): Top 5 importers of Bumpers from India EXPORT DESTINATION USA Mexico Brazil EU China EXPORTING NATION INDIA JAPAN GERMANY 2.50%* 2.50%* 1.34%* 1.26%* 18.00% 18.00% 3.75%* 3.83%* 10.00%* 9.59%* USA 2.50%* 2.50%* 14.49%* – 1.23%* 18.00% 3.83%* 10.00%* – 10.00%* *Data for 2011 / Sources: WTO and UN Comtrade Indian exporters have a substantial opportunity at the Tier-1 level er, brakes are considered less important than bumpers; no pun intended!] In 2012, the total value of bumpers that flew out of nations’ boundary walls crossed the $4.2 billion mark (source: United Nations Statistics). India exported 5.8% of this value. How are Indian exporters performing in this overseas demand-supply game? In the largest importer markets, India’s share of exports is much higher than in the gear box category: 8.46% in US, 2.02% in Germany, 1.43% in Belgium, 0.23% in Canada, 3.18% in United King- dom, 1.95% in France, 0.57% in Spain, 0.16% in Slovakia, 1.45% in Malaysia, and 1.98% in Sweden. Overall, India supplies 3.77% of bumpers (by value) imported by the ten top markets. A good sign of exports being built on im- port needs. Where there is 3.77%, there certainly is capacity for more. There top ten markets should therefore be looked upon as potential export points for the product. Given this progress in this product category, the policymakers have pro- vided tailwind to accelerate the progress of exports in this category by includ- ing the bumper category in the MLFP undertaken a study as to how we could possibly start exports to China. It is not that easy, but there could be some sweet spots in China that need to be explored.” China is an interesting destination as far as a choice for market is concerned. And the Chinese are known for making available quality products at the lowest costs. So what’s our take on China as an export market? China is very interesting because like the focus of our government is in terms of localisation of OEMs, when we look at the Chinese case from a macro angle, in that market too, 90-95% OEMs are localised. The localisation is at the level of OEMs, so there is little opportu- nity for Indian companies to make a dent in the market. But at the Tier-1 level, Indian exporters have a substantial op- portunity, because a significant amount of products are imported into China as the Tier-1 groups are essentially either assembly or sub-assembly people. There is a significant amount of import bill and if Indian policymakers can leverage their relationship with the OEMs or Tier-1 companies in China, Indian exports can gain a strong foothold in the Chinese market as well. China is the largest auto- motive market in the world, so it cannot made on product development and get- ting the manufacturing systems in place. What will all the capital investments lead to? When OEMs and Tier-1 play- ers around the world are looking for auto component suppliers with a global presence (in the name of supply chain), where will all the money spent in inno- vation and assembly lines lead to? Obviously, it all doesn’t add up to the business of selling credit cards! The natu- ral answer is – auto component exports. Small and big. New and old. There are fortunes to be made in this business overseas, especially in Latin American, African and other emerging markets. In- dian auto ancillary players have signifi- cant opportunities to take that giant leap. While on one hand the domestic mar- ket is attracting more OEM players who are in need of localisation, on the other, global players are in search of low-cost suppliers to optimise their operations. Like we mentioned before, it might sound like the only word that bridges the words “auto component” and “bonanza” is “exports”. Actually, there’s another. “You”. Scheme (like was done to include the gear box category in June 2012). Select markets in Africa (like Algeria, Egypt, Kenya, Nigeria, Tanzania, South Africa), Ukraine, Brazil, Australia, New Zealand, Cambodia, Vietnam, China and Japan, could therefore become bigger hunting grounds for bumper exporters from In- dia. Increasing duty credit scrip rates by a percentage point or two could work magic in the name of export incentives. It will especially enable Indian exporters of bumpers to get famous in a high-growth BRIC economy like Brazil where Indian exports currently account for only 0.77% of total bumpers imported. Some food for thought there for the policymakers! Talking about exporters incentivised by the Focus Markets scheme, there are a handful of territories where Indian ex- porters have gone beyond the beta test- ing phase. And these are the very markets where new exporters can try their hands at, when it comes to exporting automo- bile bumpers and its parts thereof. The power of regulations driving forward incentivised growth can be understood from the fact that high volumes of In- dian exports fulfil demands across Spe- cial Focus Markets like Sudan, Uganda not present an opportunity, especially in the Tier-1 space. Mehta agrees on this valid explanation and talks more about the “sweet spots in China”, and adds that, “Though an option to enter China exists, but it is not that easy. It is not as if the Chinese component manufacturers are not competitive. Whatever it is we have to make sure that our landed cost in Chi- na is cheaper than the Chinese supplier. That is definitely going to be a challenge, with the fact that the cost of logistics in this country can be very high. China is very big. China can be difficult and some of the Indian auto component suppliers who have ventured into that market have had mixed results.” True – Sundram Fasteners entered China and still have presence there, while Bharat Forge entered the market and later exited it. and Focus Markets like Tanzania, Togo (where over 43% of the bumper exported are ‘Made In India’ tagged), and Ghana (10%). In Latin American markets, Indi- an exporters haven’t hit the neighbour- hoods yet – with under 2.5% of imports to their names across Special Focus Mar- kets like Argentina, Columbia and Peru. But from a long term perspective, with the Indian government relaxing norms on exports from the manufacturing sec- tor by the day, and with the new Foreign Trade Policy expected to set in place higher standards of governance and a better trading environment to make liv- ing worthier for exporters, gobbling up the profit pie from these Latin American markets will be difficult for just a hand- ful of Indian exporters. There’s room for exporters aplenty. Speaking to The Dollar Business, Vin- nie Mehta, Executive Director of The Automotive Components Manufactur- ers Association (ACMA), gives his opin- ion on which markets as per him appear the most lucrative. His easy bets: Brazil and Africa. Relatively tough bet: China. “Brazil is an important market for us. There are some sweet spots in Africa too. Interestingly, we at ACMA have also MISSING THE GOLD RUSH There is much happening in the name of capacity building. Auto ancillary play- ers around India are investing heavily in capacity building and technology upgradation. In fact, as per ACMA, on a pan-India basis, between 2011 and 2013, investments of Rs.2,500-3,000 crore were editorial@thedollarbusiness.com 46 THE DOLLAR BUSINESS II JUNE 2014 JUNE 2014 II THE DOLLAR BUSINESS 47
EXCLUSIVE INTERVIEW VINNIE MEHTA, EXECUTIVE DIRECTOR, ACMA TDB: FY2014 was a year of stagnation for automobile exports. Exports of In- dian car makers remained flat as com- pared to the previous year. But for auto component exporters, the storyline read better. There was a four-plus per- centage growth in export value. How was FY2014 particularly a “good” year for the auto component sector? VM: In FY2013, our exports stood at $9.7 billion as against the previous year’s figure of $8.8 billion. Even in the first three quarters of FY2014, auto compo- nent exports grew at 4-5%. Although the results for the last quarter are pend- ing, I am sure we should have clocked a growth of 10-15% year-on-year. As long as the rupee stays in the 55-65 range, ex- ports will continue to grow. In fact, to- day, about 25% of the auto components manufactured in India are exported. “I THINK THE EXISTING FRAMEWORK OF INDIA’S FOREIGN TRADE POLICY IS FAIRLY CONDUCIVE FOR EXPORTS IN THE AUTOMOBILE COMPONENT SECTOR” Vinnie Mehta, Executive Director, ACMA “BRAZIL AND AFRICA ARE IMPORTANT MARKETS FOR US” TDB: Besides the three largest import- ing nations of auto components from India – US, Germany and UK – which emerging markets are you betting big on at present? VM: Brazil is an important market for us. There are some sweet spots in Africa too. Interestingly, we at ACMA have also undertaken a study as to how we could possibly start exports to China. It is not that easy, but there could be some sweet spots in China as well. We are focusing on more and more exports out of India. In fact, a big delegation from India had recently visited China. China is inter- esting because like India, they too are keen on localisation. The localisation I am talking about is at the level of OEMs. Once we come down to Tier-1, we have substantial opportunities because a sig- nificant amount of products at this level are imported. We need to find a way to leverage our relationship with OEMs. We need to gain a foothold in China as it’s the world’s largest automotive market. Whatever it is, we have to make sure that our landed cost in China is less than that of Chinese suppliers. This is particularly a big challenge, considering the high cost of logistics in China. proach. You have to look at what works best for you and matches your compe- tencies. You could look at emerging mar- kets like Brazil, which offers margins, but exports technologically oriented prod- ucts. Europe happens to be the single largest export destination for us as we export high-end technology products. It all depends upon who you are compet- ing against. If the competition is relative- ly less, one can enjoy a better margin. having focused on OEMs, both in terms of quality and delivery, our acceptance in the aftermarket has also grown. In fact, in some of the mature markets like USA, we are now exploring the possibility of aftermarket exports. TDB: Would you recommend your members to set up shop in China? VM: It will be premature for me to say anything because right now we are in the process of doing a detailed and in- depth study on China. In 3-4 months, we will have an outcome and will be able to say what would be a workable strategy. China is very big. China can be difficult. Some of the Indian auto component suppliers who have been there have had mixed results. For instance, Sundram Fasteners still has a presence in China, while Bharat Forge entered the Chinese market and has now exited. What we feel is that Indian suppliers have world class competence. Therefore, it would be fool- ish for us to ignore the world’s largest au- tomobile market. Typically, we have for long been focusing on the OEM market only. When we began about two decades ago, our primary target used to be the aftermarket. Over the years, our compe- tence has grown in terms of quality, pro- ductivity and delivery. Today, about 80% of our exports are OEM and 20% are af- termarket. What is also interesting is that TDB: Which product categories in the auto component industry are the most lucrative (both in terms of demand and net mar- gins) as far as exports are concerned? VM: India’s strength is in precision au- tomotive supplies, precision casting, machined engineering goods etc. This is what we mostly export. Apart from this, we export various other items as well. TDB: Are you happy with the incen- tives being provided to exporters? Would you suggest any alteration? VM: I think the existing framework of the Foreign Trade Policy (FTP) is fairly conducive for exports. There are several products that enjoy a whole lot of in- centives. There are various export-ori- ented schemes such as Focused Product Scheme, Incremental Exports Scheme, Market Focus Scheme and the Incre- mental Exports Incentivising Scheme. By utilising these schemes, one can actually get some margins and offset taxes. The FTP has been there for the last five years and is up for a review. We have asked the government to continue with the existing policy framework since it has been very good for the industry. While drivetrain, engine and electrical parts have been the main drivers of exports growth so far, India has started to emerge as a global hub for small engines. In an exclusive interaction with The Dollar Business, Vinnie Mehta, Executive Director, Automotive Components Manufacturers Association (ACMA), explains why and how emerging markets like Brazil may prove to be a good bet for Indian auto component exporters TDB: Do you believe that auto compo- nent manufactures with a higher ex- port-domestic ratio make more profits? VM: For the year ending March 2013, we produced $39.7 billion worth of goods, out of which exports were worth $9.7 bil- lion. Hence, we export almost a quarter of our production. However, I am not in a position to talk about the profitability of companies. TDB: One way of drawing synergy could be the MNCs with presence in both India and China. For instance, SAIC which forayed into Indian mar- ket through General Motors India... VM: Although options exist, it is not that easy. It is not as if the Chinese compo- nent manufacturers are not competitive. TDB: What, according to you, are the smartest strategies that an exporter can adopt to maximise profits in the auto components exports business? VM: There’s no one-size-fits-all ap- INTERVIEW BY JAYASHANKAR MENON jay@thedollarbusiness.com 48 THE DOLLAR BUSINESS II JUNE 2014 JUNE 2014 II THE DOLLAR BUSINESS 49
RENDEZVOUS “THE NEW POLICY SHOULD FOCUS ON SERVICES EXPORTS” AJAY SAHAI, DIRECTOR GENERAL & CEO, FIEO support even though it may be termed as subsidy. Relative change in Sensex and Indian exports TDB: Expanding the Focus Product list by adding small items will obviously lose its relevance. If we include every- thing, it isn’t focussed either. What are the alternatives for the government to boost exports? AS: For boosting exports, the government needs to look be- yond conventional merchandise. However, the present support to merchandise exports should continue as they are important for employment generation as well. On a rough estimate, every $10 billion of exports generate one million jobs, though it var- ies from sector to sector. 6- 5- 4- 3- 2- With the government earmarking just Rs.200 crore for marketing support to Indian exporters, the job of the head of the Federation of Indian Export Organisations (FIEO) is definitely not enviable. However, an unperturbed Ajay Sahai, Director General & CEO of FIEO, is going about doing his job with the determination that has to be seen to be believed. In an exclusive interview with The Dollar Business, Sahai talks about a host of issues pertaining to Indian exports and why the focus of the new policy should be on exports of services 1- TDB: Since the government is contemplating on restructur- ing the Foreign Trade Policy instead of focussing only on in- centives, what will be the focus of the new Policy? AS: The focus of the new policy should be on services exports, project exports, E-Commerce, merchandise trade, etc. We have treated services exports unfairly, which has to be provided a level-playing field such as interest subvention, exemption from service tax on Mode 2 of services and incremental export bene- fits on services exports to name a few. Similarly, a strategy needs to be drawn to support project exports, which promotes both merchandise and services. We have not yet exploited the po- 0- FY04 FY05 FY06 FY07 FY08 FY09 FY10 FY11 FY12 FY13 Sensex Exports Source: Commerce Ministry, BSE AS: We feel that either these schemes will continue with some minor modifications or similar benefits might be extended in some other form. Most of these schemes have been in oper- ation for a short span of just 4-5 years and therefore should continue with necessary fine-tuning. INTERVIEW BY JAYASHANKAR MENON TDB: The central government is likely to turn down the industry’s demand to widen the scope of focused export schemes (FES) for pushing exports under Foreign Trade Policy 2014–19. In turn, it is exploring options that do not have fiscal implications and are compliant with WTO norms. What is your view on this? AS: The industry is asking for reviewing the scheme so that the products and/or the markets, which have done well in the past few years, may be taken out of the ambit of these benefits. This is because exporters have found a firm footing in such markets. We are also of the view that the government needs to bring countries with whom we have signed FTAs/CECA/ CEPA within Focus Market Scheme or Market Linked Focus Scheme so that the advantage of ‘Zero Duty’ can be exploited with a more focussed approach. We are in agreement with the government to provide non-fiscal incentives aimed at reduc- ing the transaction cost of exports which, as per government figures, work out between 8% and 10% of FOB value. If 50% of the cost is addressed, it can provide $12-15 billion support to the export sector without any cost to the exchequer. TDB: Do you feel reward schemes like FMS and FPS that offer duty credit scrips, are the best way to promote exports? AS: Reward schemes offset the disadvantages faced by the Indian exporters and make them competitive. High cost of inland freight, ground level transaction cost, rising cost of credit are some disadvantages faced by Indian exporters. The promotional schemes provide some cushion to absorb these costs. Had it not been for promotional schemes, many prod- ucts would have become history. WE EXPECT THE UNION BUDGET TO PROVIDE CORPUS FOR AN AGGRESSIVE MARKETING DEVELOPMENT FUND TO HELP US MARKET OUR EXPORTS TDB: How do our exports benefit when countries with whom we have FTAs, bilateral investment promotion and protection agreements and comprehensive economic al- liance agreements, are brought under the Focus Market Scheme? AS: Bringing such countries under the purview of FMS will help in exploiting the market and addressing the issue of rising trade deficit with some of the trading partners. tential of E-commerce, which can be a plank for new entrepre- neurs in the field of exports. Certain procedural complexities need to be addressed to harness the potential of this sector. TDB: With the Commerce and Industry Ministry firming up its mind to roll out the new FTP after Budget 2014-15 is pre- sented this year, what major changes do you foresee? AS: We expect the Union Budget to provide corpus for an ag- gressive Marketing Development Fund to support our exports. At present, the total marketing support available to the export sector is less than Rs.200 crore against an export of Rs.18,00,000 crore. The Budget should also encourage investment in manu- facturing through removal of the threshold of Rs.100 crore for investment allowance. The new trade policy, besides providing framework for operation of these schemes, should also encour- age bringing out new technologies in the exports sector. TDB: In March, India’s exports dipped 3.15% y-o-y to $29.58 billion but for FY2014, exports grew at 3.98% y-o-y to $312.36 billion. What is your forecast for the next fiscal? AS: We have started FY2015 on a positive note with positive exports in April 2014 and a moderate trade deficit. With world trade expected to grow by 4.7% in CY2014 as against 2.1% in CY2013, we expect Indian exports to grow by at least 15% in FY2015. However, much will depend on the performance of manufacturing sector; if we achieve a 5% growth in manufac- turing, we will surpass this target. TDB: Since both the Ministry of Commerce and Ministry of Finance are not in favour of additions to the FMS and FPS because of revenue implications, what is the way forward? AS: Focus Market and Focus Product schemes have not been questioned so far under any of the countervailing action taken by any country against India. Therefore, we should not draw conclusions on our own. However, such schemes may not strictly test the parameters fixed by the Agreement on Subsi- dies and Countervailing Measures (ASCM). Nevertheless, In- dia being in the list of Annex VII countries, can provide such TDB: What will be the new or additional focus of the gov- ernment, especially in connection with the issue of offering a slew of incentives under Focus Market Scheme, Focus Prod- uct Scheme and other such schemes? jay@thedollarbusiness.com 50 THE DOLLAR BUSINESS II JUNE 2014 JUNE 2014 II THE DOLLAR BUSINESS 51
DOCKYARD VISAKHAPATNAM PORT A mechanised container loading crane at work at the Visakha Container Terminal ON THE FAST TRACK TO RECLAIM LOST GLORY Once India’s 2nd largest port, in terms of cargo handling, Visakhapatnam was, until recently, fast losing out to competition. However, with a new management at the helm and realisation finally sinking in that the need of the hour is to either perform or perish, the port authority is going all out to woo back users. To enable this, not only is the port authority spending big bucks on improving infrastructure but is also trying to bridge the existing gaps when it comes to communication. While the intentions sound great and doable, it is the actual implementation on the ground that will decide the future of the port BY SISIR KUMAR PRADHAN 52 THE DOLLAR BUSINESS II JUNE 2014 JUNE 2014 II THE DOLLAR BUSINESS 53
DOCKYARD VISAKHAPATNAM PORT W ha by Adani Ports & Special Economic Zone, Mundra becoming the first Indian port to cross 100 MT cargo mark, etc.), an early morning call one Sunday from my office asking for a field visit to the Vi- sakhapatnam Port felt both exhilarating as well as annoying. It was a Sunday and I was still half asleep. But I hardly had a choice. So, as I started making plans for the journey, the first surprise (actually, not really a surprise considering that 21 million passengers travel daily on Indi- an Railways) was to see the long wait- ing list in Vizag-bound trains. Giving up on trains, I booked myself on a nice multi-axle bus, stuffed my bagpack with my camera, iPad, cellphones (our report- ers carry two on all field trips to mini- mise handicaps caused by lack of oper- ator signals in certain zones) and some ith the media glare firmly focussed on various ports over the last few months (with news like the possi- the port back to its glory days. He feels the fight back will begin in right earnest once the mechanisation and moderni- sation of the cargo handling dockyard is over. Speaking to The Dollar Business, he said, “It will be difficult for any port in India to dislodge Kandla Port from the top spot since it caters to a vast area spread over Gujarat, Madhya Pradesh, Uttar Pradesh, Rajasthan, Uttarakhand, Punjab and Himachal Pradesh. A signif- icant share of India’s crude oil imports also come via the Kandla Port.” cause of ongoing projects,” he tells The Dollar Business. By the time this story goes to print, tenders for northern arm dredging, to increase a draft from 10 to 14 metres by December, would have been finalised. [The port has al- ready spent Rs.230 crore on increasing the draft.] Bigger vessels would be able to enter the inner harbour from January, once the dredging is over. 2009 as the steel major found that using the private port was more economical due to its proximity. The second blow to Visakhapatnam Port came in the form of closure of Hindustan Zinc in 2012. Nevertheless, VPT Deputy Chairman G. V. L. Satya Kumar is not a worried man. While speaking to The Dollar Business, he says, “When a major port reaches its peak capacity, traffic will be diverted to other ports.” He feels that the region has enough economic activities to feed all the ports in the east coast. The ground reality, though, gives a picture which is in total contrast to what the port authority claims. The approach road to the administrative office is full of potholes and one can notice a thick lay- er of dust covering its neighbourhood. Most of the stevedoring agents carry out loading and unloading of bulk cargo manually and with the help of excavators and earth movers. This open handling of cargo leads to heavy air pollution and the quantity of dust particles in the air is so high that lung diseases and eye infec- tions are very common in the area. “It is the job of the stevedoring agents to take actions to keep pollution under control. However, some of them are not following the pollution control guide- lines. The port authority is helpless as there is severe shortage of manpower, so we cannot keep a watch on the vast areas where loading and unloading ac- tivities are going on,” Satya Kumar tells The Dollar Business. Despite spend- ing Rs.14,234.7 crore on management and general administrative expenses during FY2013, the fact that the port has trimmed down the number of its per- manent employees from around 10,000 to 4,000 in the last decade and aims to reduce it further to 2,000, might be a rea- son for the poor state of affairs. spare change of clothes...and set out for the ‘City of Destiny’. The journey from Hyderabad to Vi- sakhapatnam was mostly smooth. The air-conditioning of the bus keept the heat out, and before I could realise, I had dozed-off. Suddenly, a jarring jolt shook me (and most other passengers) out of my slumber. It was a good wakeup call as the bus was just entering the Port City. The splendid mountain range that wel- comes you to Visakhapatnam is a beau- tiful sight. VISAKHAPATNAM PORT HAS LOST TWO OF ITS MAIN CLIENTS IN A SPAN OF FIVE YEARS ble acquisition of Dhamra Port in Odis- num (MTPA) to 120 MTPA. Under the Union government’s maritime agenda 2010-20, Rs.10,000 crore would be spent in a phased manner on several projects during the next six years. Dredging in the outer harbour is complete and with modernisation of the general cargo berth, bigger vessels can be handled at VPT. The dredging work up to the turn- ing circle is likely to be completed by Au- gust, while the remaining work is expect- ed to be over by December. “Cargo handling to an extent during the past two or three years. Even during the current year, there could be some impact, be- NOT A CAKEWALK R. Rajesh, who has more than a decade of experience in port operations and is currently looking after his company’s affairs at both the Visakhapatnam and the Gangavaram Ports, says that (on the condition that his company’s name won’t be revealed) it will be difficult for Visakhapatnam Port to regain lost glory. Reason: The port has lost its two major clients – Visakhapatnam Steel Plant and Hindustan Zinc – within a span of five to six years. VPT lost the Visakhapat- nam Steel Plant to Gangavaram Port in JEWEL OF THE EAST Visakhapatnam Port Trust (VPT), which was at the no.2 spot in terms of cargo handling just a decade back, has now slipped to the fifth position. Irrespective of what the reasons were, this has drawn a flak from all stakeholders and the blame game is on. However, the newly appoint- ed Chairman, M. T. Krishna Babu, who took charge on May 12, 2014, is confi- dent of turning things around and take FIGHTING BACK During our conversation with Krish- na Babu, I learnt how VPT’s growth has stagnated for a few years since it failed to upgrade its capacity. Presently, various modernisation projects worth around Rs.2,500-3,000 crore are being executed through several public-pri- vate partnerships. This will increase the port’s cargo handling capacity from the existing 80 million tonnes per an- had suffered A container vessel getting ready for transhipment at the Visakhapatnam Port. The port is one of India’s largest seaports and has the country’s oldest shipyard Cargo handled by Visakhapatnam Port 68- 66- 64- 62- 60- 58- 56- 54- 52- FY10 FY11 FY12 FY13 FY14 Source: VPT Administration Report (million tonnes) Commodity-wise cargo handled 13.00 Iron Ore & Pellets 14.29 Other Cargo ALL IS NOT LOST Until recently, Visakhapatnam Port was the only major port between Kolkata and Chennai Ports with multi-commodity handling capacity. Paradip Port had its berthing limitations. VPT’s proximity to Singapore, a major transshipment hub, has also contributed to the port’s growth. During the year 2000, there was a rise in the number of mines and mineral-based 4.92 Container Cargo 14.01 POL 2.61 Fertilisers & Raw Materials 6.93 Coking Coal 2.74 Thermal Coal Source: VPT; data for FY2014 (million tonnes) 54 THE DOLLAR BUSINESS II JUNE 2014 JUNE 2014 II THE DOLLAR BUSINESS 55
1 1 2 DOCKYARD VISAKHAPATNAM PORT Manral. Rake evacuation is also another problem area and there are not enough rakes available for cargo evacuation. Another major hurdle that some ex- porters face is the non-availability of LCL (Less-Than-Container Load). Cur- rently, only 12-13 multinational shipping companies like Maersk, Hyundai, Han- jin, APN and Evergreen Line operate from VCT. The average container freight rate for shipping out from VCT to New York is $4,200 and if it is to an inland destination like Boston, where there is a need for multimodal transportation, the cost goes up to about $6,300. the outskirts of Visakhapatnam. The cost of documentation is very high. The policymakers too frequently change or introduce new guidelines for importers and exporters. For one shipment, an ex- porter has to submit documents to var- ious agencies like customs, port, banks, excise department and the DGFT etc. The government should come forward with a single window system, where one can submit the document for all the con- cerned authorities.” Further, there have also been allegations that exporters and importers have to keep the various stake- holders “happy” for faster berthing of ships, allocation of wagons and clearance of cargo at the Port. 3 3 4 A view of the Vedanta General Cargo Handling Berth (VGCB) at Visakhapatnam Port: VGCB is a 74:26 JV between Sterlite Industries India and Leighton Welspun Contractors NOW OR... There isn’t much time left for VPT au- thority as Paradip Port has already start- ed the process of complete mechanisa- tion and the Adani Group is eyeing the east coast by acquiring the Dhamra Port. All this means VPT’s new boss has to hit the ground running if he wants to win glory days back for the Vizag Port. Several exporters and importers tell The Dollar Business that in order to en- sure minimum idle time for vessels and post-handling delay at berths, it is neces- sary that information sharing interfaces between the port, the customs depart- ment and users become more efficient. However, G. Sambasiva Rao, MD, Sravan Shipping, sees a bright future for the port. “VPT has been declared as the second preferred port after Calcutta Port for users from Nepal. It has a vast hinterland where heightened economic activities will fuel growth,” Rao tells The Dollar Business. One sincerely hopes that the optimism shown by him and many other stakeholders of VPT becomes a re- ality, particularly now that the Telangana issue has been resolved. Three days at VPT made the challeng- es more apparent. Those that made me forget the beautiful sight of the moun- tains that welcomed me to Vizag. But as they say, destiny has its own plans. And with the new VPT boss working 18-hours each day, change could just be a sweet mile away. They don’t call it the ‘City of Destiny’ for no reason! FINALLY PROACTIVE The Visakhapatnam Port authorities, in recent times, have woken up to compe- tition from Gangavaram Port. Two ma- jor developments, in order to tackle the competition, are the creation of the Vi- sakhapatnam Cargo Terminal (VCT) and Vedanta General Cargo Berths (VGCB). Before the establishment of the VCT, im- porters and exporters from the hinter- land used to depend on Chennai Port for container cargo shipment. According to VCT Deputy General Manager (Business Development), P. Balakrishnan, “Vizag Cargo Terminal has the capacity to han- dle 1,500 cargoes in 36 hours, which is at par with any other international con- tainer handling port.” Prior to the VCT, sea food exporters used to export their shipments from berth number L17, which was right next to a coal berth. This used to be a concern for exporters as dust particles were all over the place. Since its inception, VCT has seen a significant rise in users. Despite claims of availability of enough number of berths by port au- thority, congestion and berthing related delays have increased over the years. Due to the non-availability of berths, import- ers and exporters, have to pay demurrage charges. So are mechanised berths the answer to decongest the port? “Mechanised ports provide the ad- vantage of faster loading and unloading which in turn, improves the turnaround time with vessels being released at a faster pace,” D. K. Manral, CEO, Vizag 5 5 COMMON SIGHTS AT VIZAG PORT 1) At the Vizag Port, the emphasis on environment conservation is quite visible 2) The administrative office of the Vizag Port wears a quiet look even on a working day 3) A defunct metal detector calls for modernisation at the port 4) A customs department patrolling ship under repaire at the Visakhapatnam dry dock 5) A welder trying to fix a fishing trawler at the local fishing harbour A ship docked at the outer harbour of Vizag Port: Bestowed with natural deep water basins, the outer harbour can accommodate 1,50,000 DWT vessels and draft upto 17 metre General Cargo Berth (VGCB), tells The Dollar Business. Mechanised cargo han- dling facilities not only reduce faster evacuation but is also more cost effective due to faster turnaround time. The cov- ered operation with water sprinklers also keeps air pollution under control. The mechanised coal handling facility is ca- pable of discharging 75,000 tonnes a day as compared to 15,000-20,000 tonnes of cargo per day in manual mode. industrial activities in the hinterland. The seafood sector kept the port busy. A large quantity of project cargo also land- ed at the port. However, the stagnancy perhaps came about because of complacency. The port authority failed to upgrade their car- go handling capacity on time. This led to a major congestion. And private and non-major ports located in the vicinity made the maximum of this. Port users complain that out of 23 berths, only the oil berth and the Vedanta General Car- go Berth (VGCB) are fully mechanised. The remaining berths are not fully sooner than later they are going to be out of business. A senior official with Inte- gral Trading & Logistics tells The Dollar Business, “Mechanisation is the future. Though it requires huge investment, it also provides faster turnaround time.” In fact, the company has started to develop itself as a customs freight station (CFS). A CFS typically operates outside the port area to decongest traffic inside the port. mechanised and hence depend on port sourced equipment for loading and un- loading. Even the poor quality of equip- ment affect productivity. However, Port officials tell The Dollar Business that they have outsourced repair and maintenance work. Sources also say the Port does not have adequate equipment to meet user requirements. There have been repeated demands from users for better equip- ment like mobile cranes of 150 tonne capacity and shore cranes of 40 tonne capacity. But these demands have re- mained just that – demands. MONEY MATTERS Inter-port challenge has forced private port operators to cut down their tariff. The tariff at major ports are governed by the Tariff Authority of Major Ports (TAMP), which is about 40% less com- pared to private ports. Non-availability of storage space is another major chal- lenge. “Gangavaram Port is giving the option of 60 days of free storage as is a green field project and has lots of vacant land. However, the Vizag Port gives an option of just 10 days of free storage, after which the user has to pay rentals,” says MORE TO COME The VPT Chairman has assured that steps will be taken to increase the draft of inner channel to anchor larger vessels. The port will opt for the PPP mode to mechanise some more berths. However, some tipper operators fear that they might lose business due to the mechanisation. The port authority says this is the only way out to tackle competition and stay in the business. Even stevedoring agencies have learnt that no matter how much they lobby, PAPER TRAIL One of the major challenges at most major ports in India is multiplicity of documentation. While speaking to The Dollar Business R. V. S. Raju, President of the Visakhapatnam based manufacturer of refractory products RHI Clasil Ltd., says, “I import and export around 4,000 tonnes of cargo every month for the re- fractory manufacturing unit located on VISAKHAPATNAM CARGO TERMINAL HAS THE CAPACITY TO HANDLE 1,500 CARGOES IN 36 HOURS sisir@thedollarbusiness.com 56 THE DOLLAR BUSINESS II JUNE 2014 JUNE 2014 II THE DOLLAR BUSINESS 57
EXCLUSIVE INTERVIEW “VIZAG PORT IS NOT IN DECLINE” G. V .L. SATYA KUMAR, DEPUTY CHAIRMAN, VISAKHAPATNAM PORT TRUST TDB: Competition among ports has increased in recent times. What is the USP of Visakhapatnam Port and why should one choose it over other ports on the eastern coast? SK: The biggest USP of Visakhapatnam Port is the depth of water at the outer harbour. Moreover, we have a state-of- the-art mechanised coal and iron ore handling facility that can evacuate cargo at a much faster pace as compared to any other port in our vicinity. With faster cargo evacuation, a user saves money by releasing the vessels in quick succession. Vessel turnaround time is a major factor for the success of any port. The more quickly you release the ship, the more are the benefits for all the parties in the value chain. The increase in the quantum of cargo at Visakhapatnam Port is essen- tially occurring in three segments. They are: crude oil, coal, and container seg- ment. For all these three segments, Vi- sakhapatnam Port provides mechanised facilities, apart from the water depth to handle the largest of vessels. So, as far as these sectors are concerned, we have one of best of facilities in India. go handling. We are not thinking about growth till the modernisation projects are complete. sakhapatnam Port Trust charges around just Rs.160/tonne. Going forward, pri- vate ports just won’t be able to compete with us on the price front. VPT HAS AWARDED AN ERP TO TCS FOR A SEAMLESS FLOW OF PAYMENT AND DOCUMENTS, WHICH WILL GO LIVE SOON TDB: Most modernisation projects at VPT have been launched during your tenure. But the Port has not achieved the desired growth because of it reach- ing full capacity. So, why was capacity enhancement not planned in advance? SK: In 2008, our coal handling capacity was 20,000 tonnes/day per berth. The same year, the Krishnapatnam and Gan- gavaram ports started operations. Each had a capacity to handle 80,000 tonnes of coal per day. So, we had to take a de- cision whether to modernise or just ex- pand capacity. In the shipping business, it is all about per tonne cost. The differ- ence between handling larger vessels and smaller vessels is around $5/tonne and if you multiply this to the entire 14 million tonnes of coal that we handle, the sav- ings for our customers turns out to be humongous. So, we decided to dredge our water depth to accommodate larger vessels instead of just trying to enhance the Port’s cargo capacity. TDB: A large chunk of your business comes from Odisha and other neigh- bouring states. Reports indicate that Visakhapatnam Port has also lost out in a big way to Paradip Port due to a lack of available rakes. Your take? SK: About 70% of cargo is moved through rail. We have around 220 kilo- meters of dedicated railway lines. Our relationship with the Waltair division is very good and availability of rakes has never been an issue except during the peak season. At the same time, 70% of the railway division’s earnings come from inward and outward port traffic. Unlike other ports, we have both inward and outward rail traffic. As far as Paradip is concerned, crude oil and coal are the major contributors to its growth. Earlier, we used to handle big oil ships, transship them to smaller ports, from where the crude oil used to reach Haldia. Now, In- dian Oil Corporation has laid a pipeline from Paradip to Haldia for the move- ment of oil directly from the port to the refinery. Hence, we lost out on around 3 MTPA of cargo. Moreover, Mahana- di Coal Fields’ mines in Talcher and Ib valley are very close to Paradip. Hence, Tamil Nadu Electricity Board imports them via Paradip Port. As you can see, we losing out on these businesses had nothing to do with our capabilities. sults in the near future. TDB: A large number of exporters and importers complain that paper work is a cumbersome and time consuming affair. What steps are being taken by VPT to streamline the process? SK: Apart from mechanisation and mod- ernisation, automation is also among our priorities. In 2011, Visakhapatnam Port Trust awarded an ERP project to TCS to ease the documentation process, which will also have a customer interface for a seamless flow of payments and docu- ments. About 80% project related work is complete and it is likely to go live in the next 2-3 months. It will completely eradicate the manual interface of various agencies involved in the import and ex- port process. It will also allow importers and exporters to file their shipping bills and other documents online. India’s primary port on the eastern coast is slowly losing its numero uno status. A host of issues trouble it. The primary one being competition from private ports! In an exclusive interaction with The Dollar Business, G. V .L. Satya Kumar, Deputy Chairman, Visakhapatnam Port Trust, talks about the many challenges the port is facing and argues why it’s still a better choice over other ports on the east coast of the country INTERVIEW BY SISIR KUMAR PRADHAN TDB: One of the major reasons for VPT slipping in terms of performance was its failure to upgrade capacity. What are you doing to rectify this? SK: In the last 4-5 years, our cargo han- dling capacity reached its saturation lev- el of 60 to 65 million tonnes. Following this, we commissioned two major coal handling projects and hence this year, the port’s capacity increased to 82 mil- lion tonnes – an enhancement of rough- ly 15.5 million tonnes as compared to FY2013. Currently, we are operating at 70% capacity utilisation. Earlier, we used to operate at 100-105%. The indus- try parameter is that ports should op- erate at around 70% to ensure seamless movement of traffic. Any rise above this will lead to congestion of movement in terms of vessel or rail etc. As six more mechanised cargo handling projects are on the anvil, we are planning to augment our cargo handling capacity to around 120 Million Tonnes Per An- num (MTPA) by FY2017. The challenge for us is to complete the modernisation work without affecting our regular car- TDB: Dredging of channels requires large investment. Where did the fund- ing come from? SK: The inner harbour dredging was funded by our internal accruals. Howev- er, the outer harbour dredging is being partly funded by a loan from Japan In- ternational Cooperation Agency (JICA). TDB: What do you have to say to re- ports that Gangavaram Port has taken away a major chunk of your business? SK: This is a myth. The cargo which has gone to Gangavaram port has nothing to do with VPT. Let’s take the case of the Visakhapatnam Steel Plant (VSP), which is a 3.6 MTPA steel plant and is in an expansion mode. The VSP is lo- cated at Gangavaram’s backyard. This proximity allowed the installation of a conveyor belt to transport coal from the Gangavaram Port to the VSP. I agree that we lost out on this business but that is something based on pure eco- nomics and is not a statement on our capability. I would also like to add that Gangavaram had an advantage a year back because we didn’t have the mech- anised coal handling facility. But all such competitive advantages have been nullified after our modernisation. In any case, private ports charge around Rs.250-300/tonne of coal whereas Vi- TDB: Several special economic zones (SEZs) have come up in and around Visakhapatnam. Are they contributing significantly to your business? SK: The special economic zones around Visakhapatnam generally produce high value commodities, which are primarily moved in containers. The traffic at VCT has been growing at a CAGR of 26% over the last five years. Last year, we handled around 0.26 million twenty-foot equiva- lent unit (TEU) of container cargo. We are the primary port for containers since no other port in our vicinity handle con- tainer cargo. We also have plans to devel- op a port-based special economic zones on about 300 acres of VPT land. All these measures will certainly start yielding re- TDB: In the last couple of years, a large number of ports have sprung up in India. Do you think there is enough cargo to sustain all these ports? SK: It all boils down to economic growth. For example, in Gujarat there are about 120 ports on a 500 km coastline. Though many of them are yet to make profit, there is an air of optimism for obvious reasons. So, if the economy manages to get out of the current slump, I don’t see any reason why the sector won’t do won- ders. This is particularly true for the east coast, since we have only a limited num- ber of ports unlike along the west. sisir@thedollarbusiness.com 58 THE DOLLAR BUSINESS II JUNE 2014 JUNE 2014 II THE DOLLAR BUSINESS 59
POLICY MONITOR PRADIP THAKKAR, VICE-CHAIRMAN, PLEXCONCIL pired on March 31, 2014. I hope this is taken care of by the new government in the upcoming Budget. developed economies, taxes input mate- rials or services used for exports. Why should there be so many strings attached and cumbersome refund procedures or licensing procedures? All such hurdles have to go if we seriously want to pro- mote exports and compete globally. And this should happen across all sectors and not only in plastics. India: Plastics exports versus imports ($ million) TDB: What are the main demands of the plastic industry? PT: In the short run, PLEXCONCIL has recommended that plastic processors be encouraged through policy initiatives like duty-free scrips. This will enable the holder of such duty scrips to import inputs that go into manufacturing of the products that are exported, or, ma- chinery used for producing such goods without paying duties equivalent to the printed value. For example, if a plastic processor has a duty-free scrip valued at Rs.10 lakhs, then the holder can use it to import such goods without paying duties up to Rs.10 lakhs. 10- 08- 06- TDB: US is one of the main consum- ers of plastic products. Reports sug- gest that it imports nearly 29% of its requirements from China but merely 1.5% from India. What is PLEXCON- CIL doing to reverse this trend? PT: As I have already said, achieving economies of scales is the key factor. Our scale of production is very low as compared to China’s. Moreover, the do- mestic market also has a high potential. Therefore, dedicated plastics processing parks and a Technology Upgradation Fund have to be put in place if we actu- ally want to attain anything close to what China has managed to achieve over the last few years. 04- 02- 0- FY10 FY11 Exports Imports Source: Commerce Ministry *The Dollar Business Intelligence Unit FY12 FY13 FY14* TDB: Why this emphasis on plastics processors? And how does it contrib- ute to exports growth? PT: Plastics processors must be encour- aged to export plastic components to OEMs. PLEXCONCIL estimates this export potential to be over $3 billion and currently, India’s share is negligible. High technology plastic items must also get a similar treatment. For Micro, Small and Medium Enterprises (MSMEs) that dominate the plastics processing sector, service centres should be created to of- fer basic services like product design- ing, prototyping, and tooling in order to achieve economies of scale. All such quick services will help a small plastic player to think beyond the domestic market, which he presently doesn’t. TDB: What other policy initiatives are sought by PLEXCONCIL from the new government? PT: From a long-term perspective, PLEXCONCIL has recommended poli- cy initiatives to set up dedicated plastics processing parks and creation of a Tech- nology Upgradation Fund (TUF). This will address the primary issue of lack of economies of scale in plastics processing, which is of utmost importance to the en- tire sector. “WHY SHOULD THERE BE SO MANY STRINGS ATTACHED TO REFUNDS AND LICENSING?” TDB: A vast majority of plastics man- ufacturers are against FTAs? What are the specific reasons for such a stance? PT: There is no evidence indicating any discomfort. In my view, they are protest- ing against the inclusion of raw materials and some semi-finished items in FTAs. However, we have not really gone into the details of whether there are any op- portunities because of FTAs. We intend to do a detailed study and only after that will I be able to make a comment. TDB: Does India lose out to other countries because of incentives pro- vided by their respective governments? If yes, which country according to you provides the best incentives? PT: Generally one talks only about Chi- na when it comes to subsidies. But, we do not know the minute details of their sub- sidy system. However, despite this, India has made a name for itself in few seg- ments like polymers, woven bags/FIBCs, PET film, etc. I don’t see any reason why other segments cannot achieve the same. sachin@thedollarbusiness.com TDB: The Reserve Bank of India has plans to introduce currency notes made of polymers like we have in Aus- tralia, Singapore and Canada. What would be the impact on the plastics in- dustry if this is implemented? PT: It is difficult to say anything about this right now. But, this can certainly help the plastics industry as a new ap- plication. This will definitely help in im- proving the image of plastics industry apart from boosting production. It will also help bring in new technologies and skills to the industry along with increas- ing our knowledge base. TDB: The plastics industry has long been demanding that the government should create a level-playing field for Indian manufacturers. Where do you stand on this issue? PT: As regards to a level-playing field, which would help us compete against cheaper imports, I won’t be able to com- ment at this stage. This issue was con- tained in the Interim Budget. So, we will have to wait for the new Budget from the new government. One aspect we were certainly expecting was the continuation of interest subvention scheme which ex- It’s a common sight in our industrial, commercial and even personal lives. Plastics. What’s unfortunate though is that India’s share of it in global trade is less than 3% – insignificant! Last year, India’s exports of it to US was 5% of that of China’s. The Dollar Business caught up with Pradip Thakkar, Vice-Chairman, PLEXCONCIL to figure out what’s ailing Indian plastics OUR ESTIMATES SUGGEST THAT THE EXPORT POTENTIAL OF PLASTIC COMPONENTS TO GLOBAL OEMs IS OVER $3 BILLION AND INDIA’S CURRENT SHARE IS NEGLIGIBLE TDB: Is subsidy the only solution to the plastics industry’s problems? PT: It is not always necessary to have very high subsidies. But the system to provide such benefits should be very simple and should be available upfront with minimal conditions attached. No country in the world, including the most INTERVIEW BY SACHIN MANAWARIA 60 THE DOLLAR BUSINESS II JUNE 2014 JUNE 2014 II THE DOLLAR BUSINESS 61
INSIDE-OUT EU BAN ON ALPHONSO THE MANGO temporary restrictions affect a tiny percentage of the successful business we conduct with them. We are working closely with our Indian and European counterparts to resolve the issue and resume trade in these select products at the earliest,” he added. India, on its part, has threatened to drag the EU to the WTO over the decision while the Union Commerce Minis- ter has warned that the EU’s decision to slap a ban on import of the Alphonso mangoes will have “very negative fallout on trade ties.” TANGO MANGONOMICS According to studies, globally around 5.17 million hectare area is under mango cultivation and about 40 million MT of man- goes are harvested annually. Major mango producing coun- tries in the world include India, China, Thailand, Pakistan, Mexico, Indonesia, Brazil, Bangladesh, the Philippines and Nigeria. Of the total area under mango cultivation, 44% is in India, which accounts for about 38% of the global production. Andhra Pradesh, Uttar Pradesh, Maharashtra, Karnataka, Bi- har, Gujarat, West Bengal, Odisha, Kerala and Tamil Nadu are the major mango producing states in India, with UP firmly at the top. What stands out though is the fact that Maharashtra, which has the highest area under mango cultivation, ranks 10th in terms of productivity. India’s productivity of mango is in the range of 5.52 MT/hectare and 7.84 MT/hectare. T came after the EU’s Standing Committee on Plant Health found 207 Indian fruit consignments contaminated by pests such as fruit flies and other quarantine pests. Even UK’s Department for Environment, Food and Rural Affairs (DEFRA) has come out in support of the ban, claiming it was necessary because the pests were a threat to the country’s $541 million salad crop industry of tomato and cucumber. But the masses are already missing the king. A lot of newsprint and newsreel have been spent on discussing at length various aspects of the EU ban on Indian Alphonso mangoes. Media agents have played up the issue as a near catastrophe. Turns out, reality is not near what has been said or shown he ‘King of Fruits’ has lost an empire. The decision by the 28-member European Union to temporarily ban the import of Alphonso mangoes from India has trig- gered protests from not only the Indian community in Europe, but also local lawmakers and traders. The decision BY JAYASHANKAR MENON EXPORTS: BIG POTENTIAL STILL India exports mangoes to more than 30 countries. Although every third mango produced in the world is from India, it has very little share of the international market. In the year 2000, India’s share in the global mango trade was just 5.97% in vol- ume and 3.96% in value terms. Over the next 10 years, these numbers plummeted further to 4.36% and 3.11% respectively. It’s worth noting that from the year 2006, US and Japan al- lowed the import of Indian mangoes, thereby opening up new doors for Indian mango growers. But despite this, exports are not increasing at the desired pace. The major reason behind this is the unavailability of requisite infrastructural facilities in the production areas. According to the Ministry of Com- merce, India exported $48.54 million worth of fresh mangoes in FY2013, with more than 60% of it being exported to UAE (UK was at no.2; see chart titled, ‘Destinations for Indian fresh mangoes’). What is also interesting is that Indian mango exports to EU are just a fraction of its total exports. Similarly, over the last 10 years, while the average price of exported Indian mangoes have almost doubled, in terms of quantity, they jumped about the 60,000 to 70,000 MT/year mark (see chart titled, ‘Indian fresh mango exports’). This makes it abundantly clear that there is an immense growth potential for mango exports from India, the recent EU ruling notwithstanding. NOT SO SWEET People involved in the Indo-UK mango trade claim that losses due to the ban will run into hundreds of thousands of dollars. Wholesalers and retailers in Indian-dominated regions of UK have opposed the ban, saying it will hit them hard. Keith Vaz, British MP of Indian origin recently said, “This is Euro non- sense and bureaucracy gone mad. Indian mangoes have been imported to Britain for centuries. I am furious with the lack of consultation with those who will be ultimately affected by the ban.” Vaz has already written to the European Commission President after his constituents in the city of Leicester made a plea. The MP has also written to the Indian Prime Minister to ascertain if India was consulted on the matter. “Leicester held the first UK Mango Festival last year and it was an outstanding success. Millions of British people have eaten these mangoes for ages and they certainly don’t seem to have had any adverse effect on us. If this ban goes ahead, we will have to cancel this year’s festival,” Vaz added. A shopkeep- er in Leicester said the ban could see city retailers’ profits fall by thousands of pounds. Rajesh Pabari told a news agency that last year, he had made over $15,000 by selling mangoes during their eight-week growing season. Another trader Dharmesh Lakhanit told a TV channel that “the fruits are ‘very valuable’ to Leicester’s economy.” Even Lord de Mauley, UK’s Environment Minister has en- tered the fray, claiming his ministry was working on lifting the ban as soon as possible. “India is a key trading partner and these Karel De Gucht Trade Commissioner, European Union Keith Vaz Member of Parliament, House of Commons, UK Alphonso is a high-priced variety of mango and is grown mainly in western India. The fruit has a sig- nificant shelf life of over a week after it is ripe making it fit for exports The EU Trade Commissioner has often been accused of shooting first and asking the question later The British MP of Indian origin has claimed that the EU ban is “Euro nonsense and bureaucracy gone mad” OF WASTED DECADES... Back in the early 70s, scientists at the Indian Agricultural Re- search Institute (IARI) ‘crossed’ various mango varieties to ar- 62 THE DOLLAR BUSINESS II JUNE 2014 JUNE 2014 II THE DOLLAR BUSINESS 63
INSIDE-OUT EU BAN ON ALPHONSO SUBSCRIBE NOW! The Dollar Business magazine Read this exclusive platform on foreign trade and get an unbeatable edge in the business of exports-imports. Welcome to globalisation! Indian fresh mango exports Destinations for Indian fresh mangoes 60 90,000 Country UAE UK Saudi Arabia Qatar Kuwait Rest Share 61.66 12.19 4.55 3.35 3.21 15.01 80,000 50 70,000 60,000 40 50,000 30 40,000 SUBSCRIBE TO E-MAGAZINE PRINT & GET FREE VERSION 30,000 20 ACCESS TO OUR 20,000 10 10 Print version No. of Issues Cover Price Discount You pay 12 1,200 10% 1,080 INR 24 2,400 20% 1,920 36 3,600 30% 2,520 12 60 10% 54* USD 24 120 20% 96* 0 0 36 180 30% 126* FY05 FY06 FY07 FY08 FY09 FY10 FY11 FY12 FY13 UAE Kuwait UK Rest Saudi Arabia Qatar Value of Exports Quantity of Exports Source: Commerce Ministry; Left Axis (million $); Right Axis (in MT) Source: Commerce Ministry; All values for FY2013 No additional delivery charges apply to India-based subscribers. *Rates exclusive of airmail charges for all international subscribers. [Applicable annual additional charges: $80 for SAARC nations; $120 for other countries.] Rates valid during the issue month only. rive at the most desirable cross-breed. After 25,000 such cross- es, they succeeded in bringing out the Amrapali and Mallika mangoes, derived from Dusehri and Neelam. Unfortunately, their finds were confined just to the laboratory files for many years. Dr. Anand Kumar Singh, himself a top mango breed- er and head of the fruit division of IARI, while speaking to The Dollar Business says, “While Amrapali is a cross between a Dusehri mother and a Neelam father, Mallika is a cross be- tween a Neelam mother and a Dusehri father. The process of crossing different varieties of mangoes might sound has- sle-free, but it is a long and tedious process.” The distinct characteristic of the pair is that the trees are concise and a farmer can easily plant 100 hybrid trees in an acre of land. When tested, these trees started yielding fruits within just three years and the mangoes were fibreless, sweet, firm and had an attractive skin and flesh colour. Despite the fact that these trees were ideal for mass production, India still wasn’t ready for the commercialisation of these mangoes. According to Singh, for a quarter of a century after these two hybrid varieties of mangoes were found, no one showed any interest. It took stagnating food grain yields, lack of irrigation and increasing cost of inputs, to convince farmers to take a se- rious look at mango farming. Since two-thirds of Indian farm- ers were small and marginal, there were political motivations too as the government started contemplating ways and means to boost agricultural incomes. “Wasted years and opportunities,” you could say! small farmer of the area, had one-acre barren land. He was en- couraged by a local voluntary organisation – Nari Vikas Sangh – to plant mangoes in 2006. Three solid years of hard work paid off as Mandi’s barren land in Gobindosol village near Jhilimili gave way to mango and cashew trees. Many small farmers across the country soon started grow- ing mangoes with vegetable inter-cropping. This became a key driver of the revolution in the cultivation of India’s most loved fruit. If back in FY2002, mango trees were planted in excess of 15 million hectares of land yielding 10 million tonnes of the fruit, a decade later, the numbers have climbed 56% (to 25 mil- lion hectares) and 72% (to a record 17 million tonnes!) respec- tively. Revolution. Truly. The formation of the Horticulture Mission dates back to 2005. The government started providing grants and subsidies to small farmers and helped them all the way from nurseries to plantations. But convincing a small farmer to grow a crop that will give returns only a decade later is a tough task. Some achievement for the likes of several voluntary organisations in the country, one of which is the Nari Vikas Sangh. Dr. Singh of IARI is very optimistic. “Only 5-6 years have passed since these hybrids became popular. Wait till they reach their high point by the tenth year,” he says. NOTE: All subscription requests are to be made for the Print version only. All approved subscriptions include both Print and e-Magazine offers. No request for standalone e-Magazine subscription(s) shall be entertained. e-Magazine No. of Issues Cover Price You pay 12 1,200 FREE WITH THE PRINT VERSION INR 24 2,400 36 3,600 12 60 FREE WITH THE PRINT VERSION USD 24 120 36 180 TERMS & CONDITIONS 1. This is a limited period offer. 2. The Dollar Business and Vimbri Media Pvt. Ltd. will not be held responsible in case of any postal / courier delay in delivery of any issue of the magazine. 3. The Dollar Business and Vimbri Media Pvt. Ltd. will not be held responsible in case of any production delay that leads to late delivery of any issue to its subscriber(s). 4. If for any reason, a certain issue of The Dollar Business is not published, the subscription will automatically be extended by a month. 5. The Dollar Business and Vimbri Media Pvt. Ltd. reserve the right to terminate any sub- scription or accept or reject any request for subscription. 6. Disputes, if any, are subject to the exclusive jurisdiction of courts in Hyderabad only. 7. Any change in periodicity of The Dollar Business magazine may apply to existing sub- scribers. They will continue receiving the same number of issues they had originally sub- scribed to. They duration between issues may however stand duly altered. 8. Any change in the cover price of The Dollar Business magazine will not apply to existing subscribers. They will continue receiving the same number of issues they had originally subscribed to. 9. It is the sole responsibility of the subscriber(s) to report delay in delivery of any issue of the magazine to the subscription department of The Dollar Business within 14 days of the issue release date. 10. It is the sole responsibility of the subscriber(s) to report non-receipt of any issue of the magazine to the subscription department of The Dollar Business within 30 of the issue release date. 11. Terms and conditions may be altered without notice to the subscribers. 12. For Delivery, Return and Refund Policies, and for more information on Subscriptions, please log on to www.thedollarbusiness.com For subscription-related queries, please write to us at subscription@thedollarbusiness.com or call us on +91 40 66770765. We’d love to hear from you! You can also write to us at: The Dollar Business, Vimbri Media Pvt. Ltd., 5-2-198/4, Distillery Road, Ranigunj, Secunderabad, Telangana – 500 003, IN Subscription for 1 Year (12 issues) INR 1,080 / USD 54* 2 Year (24 issues) INR 1,920 / USD 96* SUBSCRIBE BY LOGGING ON TO WWW.THEDOLLARBUSINESS.COM AND PAYING ONLINE (MANDATORY FOR ALL INTERNATIONAL SUBSCRIBERS) OR FILL THE BELOW-MENTIONED PARTICULARS OF PAYMENT THROUGH CHEQUE / DD MODE 3 Year (36 issues) INR 2,520 / USD 126* MISSION POSSIBLE Even as mass interest in the topic of ‘EU ban on Alphonso man- goes’ continues to mount, hybrid mangoes are silently gaining share in the largest importing maket for Indian mangoes – UAE. Other varieties of mangoes are also expected to be re- leased in the domestic market before being shipped overseas. As for the Indian Agricultural Research Institute (IARI), it is confident that the EU trouble will disappear for good and that mango exports will grow at an exponential rate in the years to come. And most importantly – that the new hybrids will prove more than scientific discoveries. New markets, new hybrids, and truckloads of optimism. Hope abounds. SIMPLY ENCLOSE YOUR BUSINESS CARD OR FILL THE BELOW-MENTIONED FIELDS TO SUBSCRIBE Name: Address: ...AND A SWEET REVOLUTION In Bankura district of West Bengal, fertile lands were identified all the way up to the Chota Nagpur plateau. Ramlal Mandi, a I am enclosing a Cheque / DD No:.................................. dated drawn on......................................... ......................................................................................... for INR1,080 / INR1,920 / favouring Vimbri Media Pvt. Ltd. payable at Hyderabad Add Rs.50 for non-Hyderabad cheques (not required for At Par cheques). Please write your name and address on the reverse of the cheque/DD. Do not send cash. Please send the filled form to: City: State: Pin code: Telephone no.(s): Email: Date of Birth (DD/MM/YYYY): Company Name: SUBSCRIPTION REQUESTS CAN BE PLACED BY LOGGING ON TO WWW.THEDOLLARBUSINESS.COM, FILLING-IN NECESSARY DETAILS IN THE APPLICATION FORM GIVEN AND MAKING PAYMENTS USING CREDIT CARDS/ DEBIT CARDS OR VIA NET BANKING INR2,520 OF THE TOTAL FRESH MANGO EXPORTS FROM INDIA IN FY13, OVER 61% WENT TO UAE The Dollar Business, Vimbri Media Pvt. Ltd., 5-2-198/4, Distillery Road, Ranigunj, Secunderabad, Telangana – 500 003, IN jay@thedollarbusiness.com TO SUBSCRIBE ONLINE: www.thedollarbusiness.com 64 THE DOLLAR BUSINESS II JUNE 2014
EXCLUSIVE INTERVIEW KISHORE TANNA, CHAIRMAN, IOPEPC TDB: A couple of weeks back, the gov- ernment took a proactive step to en- courage exports of the oilseed sector by altering the minimum export price. Are you pleased with the decision? KT: We are thankful to the central gov- ernment for bringing down the mini- mum export price (MEP). But there is a need to have a liberal and consistent ex- port policy. Frequent changes in policy are not healthy. A MAJOR HANDICAP FOR EDIBLE OIL EXPORTS FROM INDIA IS THE FACT THAT THE PRODUCT HAS TO BE EXPORTED IN PACKS OF 5 KG OR LESS “GROUNDNUT OIL EXPORTS HAVE THE POTENTIAL TO BREAK GROUNDS” In a country where exports of any variety of foodgrain is a very delicate issue and invariably assumes political colours, being the Chairman of an industry bloc such as the Indian Oilseed and Produce Export Promotion Council (IOPEPC) is definitely not easy. In an exclusive interview with The Dollar Business, Kishore Tanna, Chairman, IOPEPC, discusses issues that are troubling the oil seeds sector and all that’s needed to be done to make India a force to reckon with in the global market. Exclusive excerpts: TDB: The latest reduction in the mini- mum export price on edible oil is likely to boost exports, particularly ground- nut oil. What is your opinion? KT: The reduction in MEP for edible oils from $1,400 to $1,100 will definite- ly boost exports. This is because recent- ly there has been a fall in international prices of edible oils, especially ground- nut oil. With groundnut oil being the most exported edible oil from India, the exports are bound to rise in the near-to- medium-term. KT: Although the size of the global groundnut oil market is about 188,000 MT, during FY2013, about 16,500 MT of groundnut was exported from India. With liberal export policies and a good domestic crop, exports are expected to exceed 25,000 MT in FY2015. Guja- rat, Andhra Pradesh, Karnataka, Tamil Nadu, Odisha and Rajasthan are the ma- jor groundnut producing states in India, while groundnut oil units are mostly lo- cated in Gujarat. TDB: Policymakers do not still wel- come wholeheartedly the idea of edible oil exports. Do you think the govern- ment should shed all fears? KT: Exporting higher quantity of pre- mium high value edible oils will have no adverse impact on domestic oil prices. In fact, we can import much larger quanti- ties of vegetable oils if we start exporting high-value edible oil from India. Our es- timates suggest that with the export of a single unit of premium edible oil, about 1.25 to 2 units of other oils such as Palm oil or degummed soybean oil can be im- ported into the country. TDB: How will this benefit exporters? KT: Due to a bumper crop in major groundnut producing countries like US, China, Argentina, etc., and with stocks already at a record high, price of groundnut oil has crashed from a level of $2,450/MT in FY2012 to about $1,100/ MT at present. With oilseed production in India also high in FY2014, the reduc- tion in MEP will provide the required thrust to exports of edible oils. NEW KT: We mostly export edible oil to Chi- na, Netherlands, France and Italy. among edible oils exported from India. It is a premium oil and its cost is also high. Most other edible oils are priced lower than groundnut oil. Thus, lowering MEP will mostly give a fillip to premium oils, including Sesame oil. TDB: In December 2013, the minimum export price was reduced from $1,500/ MT to $1,400/MT. What impact did it have on exports? KT: There has been a consistent slide in international prices of groundnut oil since FY2012. So, the reduction from $1,500/MT to $1,400/MT in MEP was not sufficient to make a material differ- ence to exports. The Indian Oil Seeds & Produce Export Promotion Council (IO- PEPC) has been requesting the govern- ment to reduce MEP all throughout. Our voice was finally heard. TDB: How realistic is the hope of groundnut oil export breaching the 25,000 MT mark this year? KT: A bumper crop and a lower MEP will certainly help in increasing exports but the mandatory export in 5 kg brand- ed consumer packs is a major constraint. Other countries offer edible oils in bulk, which is cost-effective and can be re- packaged as per the requirements of the customer in the importing country. TDB: The cap of 20,000 MT was re- moved last year. What impact has this had on exports? KT: The cap was removed in February 2013, but with a high MEP of $1,500 imposed. At the same time, while India had a bad monsoon, other groundnut producing countries like US and Argen- tina recorded bumper crops. This led to a slide in international prices making In- dian exports became unviable. TDB: What scope do you see for the export of cottonseed oil? Which geog- raphies are interested in importing it? KT: Cottonseed oil exports from India is very low. It was only about 200 MT last year. It is mostly exported to Nepal, Paki- stan, Sri Lanka and Netherlands. TDB: Does fixing the floor price make groundnut oil exports the most viable among all edible oil varieties? KT: Groundnut oil ranks at the top TDB: Reports suggest that there is a lot of potential for increasing groundnut oil exports from the country. How do you think this can be achieved? INTERVIEW BY JAYASHANKAR MENON TDB: Which are the main export desti- nations for Indian edible oil? jay@thedollarbusiness.com 66 THE DOLLAR BUSINESS II JUNE 2014 JUNE 2014 II THE DOLLAR BUSINESS 67
PRIME FOCUS FDI IN RETAIL ORGANISED vs. UNORGANISED RETAIL: FINDING THE BALANCE India’s retail landscape has undergone a major transformation over the last decade, enhancing the overall consumer experience to varying degrees. The market, which is currently pegged at $500 billion and is one of the fastest growing in the world, is now expected to scale up to $1.3 trillion by 2020. But does it also mean an end to the ongoing war between organised and unorganised players? THE DOLLAR BUSINESS BUREAU, NEW DELHI Packaged food section in a modern supermarket:. The Indian packaged food industry that is currently pegged at $39.70 billion, is expected to reach $65.41 billion by 2020 R is, undoubtedly, uniquely complex in terms of the wide geographical spread and distinct consumer preferences that vary vastly in each region. Such diversi- ty lends itself to a need for localisation within each of the geographic zones. Moreover, in the present scenario, where unorganised retail formats such as tradi- tional family run stores and small shops constitute a majority of the market (at over 90%), the challenges posed can be quite daunting. Over 30% of food sta- ples and perishable goods produced in India get spoilt due to infrastructural bottlenecks. In addition to this, small re- tail outlets also prevent proper hygienic storage and movement of goods from farmers to consumers. FAR AND WIDE Moreover, a geographically dispersed population, complex distribution net- works, low Internet penetration and existence of counterfeit goods only com- pound the woes. The other side of the spectrum – organised retail – which con- stitutes only 8% of the market, has a num- ber of factors such as rapid urbanisation, a young population, rising incomes and increasing brand consciousness, helping its growth. The advantages of organised retail formats that include hypermarkets, large retail chains and privately owned retail businesses are fairly obvious. Availability of better quality products, an improved supply chain, a one-stop shop for varied choices of brands and products are some of the benefits that accrue to the consumer. Such retailers are also considered more efficient and apt to cater to the diversified nature of consumer demands, besides doling out etailing in India is one of the major revenue earners for the economy, accounting for ap- proximately 15% of the coun- try’s GDP. The market for retail in India employment options for many in lo- gistics, store management and quality checking. But this is not to say that the unorganised sector has no advantages of its own. Proximity to consumers, credit sales, bargaining and convenient home delivery options act as a win-win for this segment of retail. Small shopkeepers, of- ten, maintain a good equation with their buyers, thus converting them into loyal customers over time. By the same logic, organised retail has its share of disadvan- tages which include a lack of close inter- action with customers and a long wait time for billing. At present, India is at the crossroads as far as the retail sector is concerned. Sev- eral market economies have gone ahead and reaped the benefits of modern retail. India is, however, a latecomer to organ- ised retail expansion and the picture is not clear as to what the future holds. The jury is still out if organised retail will ever INDIA IS ONE OF THE FASTEST GROWING RETAIL MARKETS IN THE WORD. IT’S EXPECTED TO SCALE UP TO $1.3 TRILLION BY 2020 be able to overcome the unorganised retail sector in India. POLITICAL HOT POTATO The current sign of reforms, however, have heralded a wave of optimism for the retail industry in India. In 2006, 51% for- eign direct investment (FDI) was allowed in single brand retailing, although with prior approval from the government. In December 2011, the government ful- December 01, 2013; Saket, New Delhi: An Indian shopkeeper at his grocery and spices store: Proximity to consumers, credit sales, bargaining and convenient home delivery options act as a win-win for this segment of retail 68 THE DOLLAR BUSINESS II JUNE 2014 JUNE 2014 II THE DOLLAR BUSINESS 69
PRIME FOCUS FDI IN RETAIL Our Vision We intend to become the foremost authority on foreign trade in the country by giving its readers an unbeatable package of knowledge and business edge in the field of foreign trade. Our aim is not just to educate readers the way commoners do, but to empower them to evolve. That’s why we were born. And that’s why we breathe. The 4’E’s that define our 5th ‘E’ – Existence are: EXPERTISE: Who creates content at The Dollar Business We have veterans in the realm of foreign trade to do that. We have experts who analyse the outcome of a choice of product or place for export or import or the impact of a certain policy change. Each member of our editorial team has been carefully handpicked so that we create what can be priced as a product that is respected by all and one who understands or wants to understand the business of export-import. EDUCATION: We are not in love with Friedman, but we completely admire his idea of a ‘flat world’. Globalisa- tion of capitalism – is there a bigger need to educate India on why beyond borders is the next playfield to discuss and explore? From pinpointing constraints in cross-border opportunities to identifying market and product-specific tactical gambits…why leave it all to just plain luck? EMPOWERMENT: To think and not to act, is sin. Precisely why we believe in empowering while educating. The minefield of treasures that ‘The Dollar Business’ is, will not only change the way oracles in the world of foreign trade think, but also how they act, while importing, while exporting. March 3, 2014; IKEA store, Bangkok; File photo of an outlet of the world’s largest furniture retailer: The company has committed to investing over Rs.10,000 crore to set up several stores across India EVOLUTION: We communicate. We empower. We change lives – for businesses, entrepreneurs and the mil- lions of hopefuls who make claims of good news beyond borders. With ‘The Dollar Business’, evolution will occur. Not only how information in the world of foreign trade is shared, but why it is sought and how it is exploited. ly opened up FDI in single-brand retail which encouraged IKEA, the world’s largest furniture retailer, to enter India. For the much debated and political- ly sensitive multi-brand retail, partial approval of 51% FDI was proposed in September 2012, which got parliament refour, Anchan and Costco had a long settling-in period despite streamlined approval system, government facilita- tion and shorter construction periods. Despite all of this, there is little doubt that the Indian retail story is evolving at a frantic pace. And with favourable gov- ernment policies and emerging technol- ogies already in place, the future looks promising enough for this sunrise sector in times to come. approval in December 2012. However, FDI policy was modified in April 2013. Some of the conditions laid down in the policy are: 30% of procurement, in value term, needs to be sourced from India. 50% of FDI should be invested in back- end infrastructure (distribution centres, logistics, warehouses etc). Minimum investment should be $100 million. Multinational retailers can conduct business only in cities with a population of over one million. A large number of global retailers have shown interest to enter the Indian market. Tesco has signed an agreement with Trent of the Tata Group. H&M and IKEA, GAP, French apparel retailer Calio, Japanese fashion brand UNIQLO are also in various stages of entry. It will require an additional 6-10 years for the market to mature. Even in China, inter- national giants like Walmart, Tesco, Car- Retail business in India editorial@thedollarbusiness.com FDI IN SINGLE BRAND RETAIL WAS FULLY OPENED UP IN 2011 FOLLOWED BY 51% FDI IN MULTI-BRAND RETAIL Source: The Dollar Business Intelligence Unit 70 THE DOLLAR BUSINESS II JUNE 2014
NEW-GEN NEWSMAKER ANUJ MEHTA, CO-FOUNDER & DIRECTOR, PEGASUS TOYKRAFT was of high importance. This is why our toys in the art and craft category stand out in the market and have made us the leader in India with over 120 extremely popular products. “CHINESE TOYS ARE ABOUT CRAFT. OURS ARE PURE ART” The $90 billion global toy industry is competitively gridlocked; it’s not a playground for a child. But a Mumbai-based toymaker has found such a prosperously peaceful corner in the couch that the Marvels of the world have begun an envious crosstalk. Anuj Mehta, Co-founder & Director of Pegasus ToyKraft, counts proper nouns that helped make his brand a reality across 22 countries I EXPECT OUR EXPORTS TO GROW BY 30% THIS YEAR TDB: And what about competition from other countries? AM: Our competitors are way ahead of us when it comes to technology and in- novation. Their specialisation is in plas- tic toys. Though they are also present in categories of art and craft, they are more into craft than art. On the other hand, we try to give a traditional touch or an Indian theme to our toys. For instance, in art and craft category, we teach kids the traditional Warli or Madhubani art. Normally, today’s kids wouldn’t know anything about such art forms. So, we have gone back to the basics by provid- ing this unique traditional touch to our toys. This is the edge of our company in the international market. In fact, we are slowly gaining acceptability in countries like Greece, Poland, and Romania. Our exports to Russia and the Middle East are also growing. INTERVIEW BY SACHIN MANAWARIA TDB: How was your exports’ growth last year and what can we expect this year? AM: Last year, European regulations changed. Due to this, our exports were flat. Having said that, our facility is now fully compliant with the regulations of most developed countries. I expect our exports to grow at 30% this year. TDB: Only 20% of the Indian toy mar- ket is served by domestic players and rest by import of toys from various countries particularly from China and Italy. So, what actually was in your mind when you started Pegasus ToyKraft in 2007? AM: Pegasus ToyKraft is promoted by two families – the Mehtas and the Makh- ijas. The Mehtas have been in the toy in- dustry for the last four decades. In fact, the Mehtas were the OEM for Blow Plast India, which used to manufacture toys under the Leo Toys brand name. During 1998-99, when I was just out of college, the joint venture between Blow Plast In- dia and Mattel Toys collapsed. This was the time when a whole host of Chinese manufacturers were flooding the Indian streets with a plethora of choices in the toy segment. Despite being a fresher out of college, I decided to take charge of my family business, which had tremendous goodwill in the market. Soon after taking charge, I started appointing distributors across India for they are competing with established global manufacturers? AM: This is the biggest problem. Since India is not recognised as a toy manufac- turing hub, unlike China and Germany, major toy shows around the world are not enthusiastic about Indian toys. In fact, at some of the global toy fairs, even people who have been regular visitors to my stall, are yet not confident about In- dia. However, lately the rise in minimum wages in certain Chinese provinces has forced players to look towards India. shows like Nuremburg in Germany. we are getting very good response from customers. In short, we make sure that we don’t put all our eggs in one basket at any given point in time. my company’s product. I also started ap- proaching the distributors of Blow Plast. This is when I met Shyam Makhija, who happened to be one of the distributors of Blow Plast. So, for first 3-4 years my partner was selling my products through his distribution network. Interestingly, Shyam Makhija is a doctorate in organic chemistry and was then doing a research on educational aids & innovative games. He had come out with an innovative toy product line and was looking for a part- ner who could manufacture toys for him and market them across India. With a lot of cross trading happening between the two of us in the initial years, we decided to merge our entities in 2006. And this is how our synergies converged and we established Pegasus ToyKraft in 2007. Within no time we had launched around 100 odd products and started capturing new markets. By the time we launched our 150th odd product, we de- cided it was time to go global. Thus, we began exploring and started participat- ing in some of the world’s biggest toy TDB: Exhibiting at a trade show is a great way to find customers for your business. What has been your experience? AM: The results have been wonderful. Our participation in these events have ensured a steady flow of customers – both from India and overseas. Today our products are exported to over 22 coun- tries across the globe. TDB: The toy industry in India is concentrated mainly in the small and cottage sectors, with over 4,000 manufacturers producing cheaper look-alikes of original products. How does this impact your business? AM: The Indian toy market is pegged at Rs.4,000 crore with unorganised sector having a 70% market share. Although there are no major competitors in our business, we do face a lot of piracy issues. Reason: the unorganised sector still lacks innovation and access to modern tech- nology to run the business. It’s because of this we face some competition in Tier-3 towns where quality doesn’t really matter. But when it comes to Tier-1 and Tier-2 cities, we have a clear edge. TDB: How do you plan to increase your exports going forward? AM: Globally, the toy industry is driv- en by intellectual property (IP) rights. Therefore, from this very year, we have started developing our own IP, at least in categories of toys falling under Educa- tional Aids and Board Games. There is an opportunity we don’t want to miss – when we have our own IPs, even one of them clicking at the global level can do wonders for our company. At the same time, we have started approaching global players that buy or lease IPs and pay roy- alties. This will help us in future. TDB: Studies suggest that over 40% of Indian toy manufacturers have shut shop in the last five years. How have you ensured you stay afloat? AM: Even during the first 2-3 years, af- ter starting out, we were selling through a pan-India dealer network apart from having our own sales team. Today, we are present in all organised retail out- lets like Shoppers Stop, Reliance, et al. Apart from this, we also sell our prod- ucts through online shopping stores like Flipkart, Firstcry, Amazon etc wherein TDB:What about “dragon effect”? How have Pegasus ToyKraft managed to remain unaffected? AM: We clearly identified the categories where we didn’t want to compete with Chinese suppliers. These were some of the categories where we knew that we cannot compete and hence we decided to make inroads into categories of toys where Chinese players were conspicu- ously absent. We moved into categories where creativity and educational value TDB: Do Indian toys find acceptance at the global level, particularly when sachin@thedollarbusiness.com 72 THE DOLLAR BUSINESS II JUNE 2014 JUNE 2014 II THE DOLLAR BUSINESS 73
TOC EUROPE – 2014 June 24-26 London, UK www.tocevents-europe.com TOC Europe Exhibition is the undisputed global showcase of the latest port opera- tions and equipment and technology solu- tions, featuring over 160 companies from across the globe. TOC Europe offers all stakeholders in the container supply chain a full three days of content and network- ing. This year, TOC Europe will take place at ExCeL in London for the first time in the event’s history, making it a must-visit for all stakeholders. al logistics, warehousing, transport and supply chain community. Last year the show attracted visitors from 37 countries who saw 170 exhibitors displaying over 330 representative brands. September 18, 2013; Singapore: Opening ceremony of Tuaspring Desalination Plant during SIWW Water Utilities Leaders Forum (File photo) The event is a confluence of exciting busi- ness opportunities, world-class technol- ogies and enthusiastic participants from across the globe. The 8th edition of the event in 2012 witnessed representation from 14 countries and attracted more than 40,000 business visitors. ence, innovative exhibition and impressive line-up of featured programmes. SRI LANKA INTERNATIONAL AUTO SHOW – 2014 June 13-15 Colombo, Sri Lanka www.cems-motorshow.com A perfect B2B platform, the auto show is a gateway to the rapidly expanding auto- motive industry of Sri Lanka and is expect- ed to see participation from distributors, importers , garage owners, mechanics, spare part retailers and the general public. Have a product to showcase? Or want to learn what your rivals are up to? Here’s a list of Indian and foreign trade fairs you shouldn’t miss in June and July 2014 ALL IN CARAVANING – 2014 June 27-29 Beijing, China www.aicshow.com/en With the German Federal Ministry of Transport and Digital Infrastructure acting as the patron, the 3rd edition of the All in Caravaning is expected to witness over 180 exhibitors from countries like Germa- ny, France, Italy, USA, South Korea and Malaysia display their caravaning prod- ucts. Popular brands such as Fendt, Hob- by, Dethlefts, Adria and suppliers like Thet- ford, Truma, Dometic, Optiplan, Vöhringer, EuraMax, Project 2000 have already con- firmed their participation at the event, mak- ing it a must-visit for all stakeholders of the rapidly growing caravan industry. [India] INTEC – 2014 June 6-10 Coimbatore www.intec.codissia.com This much-awaited international industrial trade fair is a congregation of various in- dustries exhibiting their finest innovations and services. All geared up to mark its 15th edition, the fair has seen over 1 lakh busi- ness visitors, 200 product categories and a trade turnover in excess of Rs.300 crore in all its past editions. HEIMTEXTIL INDIA – 2014 June 19-21 New Delhi www.heimtextil.in More than 150 exhibitors from all over the world are expected to showcase their lat- est products and innovative designs at the event. Visitors will include wholesalers, distributors, interior designers and con- tract buyers from across industries. [Global] SIWW – 2014 June 1-5 Singapore www.siww.com.sg The Singapore International Water Week (SIWW) is a global platform to share and co-create innovative water solutions. A leading event on the global water calendar, SIWW delivers a range of programmes where industry players share the latest in business, scientific and technological innovation, and policy developments in water. July 2, 2013; New Delhi: A still from the Indian Warehousing Show (File photo) IWS – 2014 July 8-10 New Delhi www.indiawarehousingshow.com Running in its 4th edition, the event is at- tended by over 8,000 professionals each year representing high level decision-mak- ers and buyers from across the globe. FOODPRO – 2014 June 22-25 Melbourne, Australia www.foodproexh.com This year’s Foodpro is moving the Austra- lian food processing industry forward, with technology and innovation being brought in from all over the world. Every aspect of the food and beverage processing indus- try will be on show by over 300 suppliers, including processing technology, plant equipment, ingredients, additives, testing equipment and more. AMBIENTE INDIA – 2014 June 19-21 New Delhi www.ambiente-india.in One of the leading trade fairs for India’s interior décor and home accessories mar- ket, the event will give exhibitors an oppor- tunity to present wide ranges of products in the living, giving and dining segment. OSH INDIA July 17-18 Chennai www.ubmindia.in/osh_india The show, over the years, has been suc- cessful in creating an environment condu- cive for discussions between policymak- ers, experts and manufacturers. With the number of visitors and exhibitors going up each year, it’s one of India’s most im- portant events on occupational safety & health. AGRI INTEX – 2014 July 18-21 Coimbatore www.agriintex.codissia.com South India’s largest international agri expo, Agri Intex – 2014 is expected to draw more than 1,50,000 business visitors. HOSPITAL BUILD AND INFRASTRUCTURE MIDDLE EAST – 2014 June 2-4 Dubai, UAE www.hospitalbuild-me.com The 6th edition of the exhibition will showcase the latest in healthcare de- sign and construction in the GCC re- gion. Expenditure on healthcare is growing exponentially in the region and is forecasted to reach $133.19 billion by 2018. Log on to www.thedollarbusiness.com for more events and details. SECUTECH INDIA – 2014 June 26-28 New Delhi www.secutechindia.co.in Organised by ABECL, Secutech is a good networking and marketing platform both for domestic and international players of the Safety and Security industry. The fair is expected to magnetize over 15,000 like-minded individuals to barter ideas. June 7, 2013; Coimbatore: The 14th INTEC trade fair, held between June 6-10, 2013 (File photo) PackPlus – 2014 June 11-14 New Delhi www.packplus.in The show brings together the worldwide manufacturers of machinery, materials and services for food, pharma and packaging industry. Its last year’s edition witnessed over 50 launches, the first ever demo of a complete packaging line and more than 100 live running machines. MOBILE ASIA EXPO - 2014 June 11-13 Shanghai, China www.mobileasiaexpo.com It’s Asia’s fastest-growing and most excit- ing mobile event. Mobile Asia Expo 2013 had over 20,000 business and consumer attendees, as well as an incredible confer- INDIA TRANSPORT AND LOGISTICS SHOW July 8-10 New Delhi www.indiatransportlogistics.com ITLS is an important gathering for the glob- AMTEX – 2014 July 25-28 New Delhi www.amtex2014.com June 18, 2014; Dubai, UAE: Dignitaries at the 2013 edition of Hospital Build and Infrastructure fair 74 THE DOLLAR BUSINESS II JUNE 2014 JUNE 2014 II THE DOLLAR BUSINESS 75
UNLOCKING CASH EXPORT FINANCING SCHEME WHATEVER IT TAKES! With economies vying for a larger share of global trade that is forever changing, exporters can do with their fair share of help – those in India being no different. And while supply may not create demand at all times, easing the supply of capital to exporters is the least that can be done. The ‘Pre-Shipment Export Credit Scheme’ is one such shot in the arm of our Indian exporters. An exclusive report L mangoes and the attractiveness of prices, the importer places an order for 10 MT of mangoes in the current year. Since the order is large, in order to honour it, you would need to make a large investment in terms of manpower, pesticides, equip- ment etc. But what if you don’t have the capital to make this investment? This is where the Pre-Shipment Export Cred- it Scheme comes handy. Thanks to the scheme, you can walk into a bank and avail credit just on the basis of the order placed by the importer. In fact, even if the investment that needs to be done in order to honour the order requires for- eign currencies, the Reserve Bank of In- dia (RBI) has got you covered. BY SHAKTI SHANKAR PATRA et’s say you own a mango or- chard and have been supply- ing mangoes to an importer in London for the past several years. Happy with the quality of your cade. The Pre-Shipment Export Credit Scheme has been a welcome scheme. As per RBI, “Pre-Shipment means any loan or advance granted or any other credit provided by a bank to an exporter for financing the purchase, processing, manufacturing or packing of goods pri- or to shipment, on the basis of letter of credit opened in his favour or in favour of some other person, by an overseas buyer or a confirmed and irrevocable order for the export of goods from In- dia or any other evidence of an order for export from India having been placed on the exporter or some other person, unless lodgement of export orders or letter of credit with the bank has been waived.” And to quote the central bank again, “The period for which a packing credit advance may be given by a bank will depend upon the circumstances of the individual case...” It is primarily for the banks – giving the credit advance – to decide on the pe- riod for which a packing credit advance may be given, giving due respect to one or various relevant factors affecting ex- ports. This is, so that the period is suffi- cient to enable the exporter or trader to ship the goods or render the services. Talks are on to include export financing under priority sector lending to give further boost to Indian exporters NO FREE LUNCHES Pre-Shipment credit has its own issues though. What if the credit availed is di- verted for other purposes? And how does a bank keep track of the money that it has doled out for all practical purpos- es, it is an unsecured loan? As per RBI, “Each packing credit sanctioned should be maintained as a separate account for the purpose of monitoring the pe- riod of sanction and end-use of funds.” Therefore, banks may release the pack- ing credit in one lump sum or in stages as per the requirement for executing the orders. “Banks may also maintain differ- ent accounts at various stages of process- ing, manufacturing, etc. depending on the types of goods/services to be export- ed (i.e., hypothecation, pledge, etc.) and may ensure that the outstanding balance in accounts are adjusted by transfer from one account to the other and finally by proceeds of relative export documents on purchase, discount, etc.” What the central bank recommends is that lending banks should continue to keep a close watch on the end-use of the funds and ensure that credit at lower rates of interest is used for genuine re- quirements of exports. It is also important for banks to mon- itor the progress made by exporters in timely fulfillment of export orders. So, while pre-shipment credit provides an exporter with the required hand-hold- ing, it in no way is a free-ride. It should not be. There are “no free lunches”. And we all know that. Even exporters! earlier scheme, the RBI fixed only the ceiling rate of interest for export credit. Banks were free to decide the rates of interest within the ceiling rates keeping in view the Benchmark Prime Lending Rate (BPLR) and spread guidelines tak- ing into account track record of the bor- rowers and the risk perception. In order to enhance transparency in banks’ pric- ing of their loan products, banks were advised to fix their BPLR after taking into account the actual cost of funds, op- erating expenses and a minimum mar- gin to cover regulatory requirement of provisioning and profit margin. In 2007, the government announced a package of measures to provide in- terest rate subvention of 2 percentage points per annum on rupee export credit availed by exporters in nine categories of exports, viz., textiles (incl. handlooms), THE PERIOD FOR WHICH ADVANCES MAY BE GIVEN BY A BANK WILL DEPEND ON INDIVIDUAL CIRCUMSTANCES AND THE NATURE OF BUSINESS DEFICIT IS FOREVER For a country like India that perenni- ally runs a trade deficit, export promo- tion is at the top of every policymaker’s mind. [At least it should be!] Numerous schemes have been floated to provide stimulus to our exports in the past de- INTEREST SUBVENTION The RBI first introduced the scheme of Export Financing in 1967. Under the 76 THE DOLLAR BUSINESS II JUNE 2014 JUNE 2014 II THE DOLLAR BUSINESS 77
UNLOCKING CASH EXPORT FINANCING SCHEME readymade garments, leather products, handicrafts, engineering products, pro- cessed agricultural products, marine products, sports goods and toys and to all exporters from the SME sector de- fined as micro enterprises, small enter- prises and medium enterprises for a pe- riod from Apr. 1, 2007 to Sept. 30, 2008. The coverage was also extended to in- clude jute and carpets, processed cashew, coffee and tea, solvent extracted de-oiled cake, plastics and linoleum. Further, in respect of leather and leather manufac- tures, marine products, all categories of textiles under the existing scheme (including readymade garments and carpets, excluding man-made fibre and handicrafts), the government provided additional subvention of 2% in pre-ship- ment credit for 180 days. In order to ensure that a borrower is not unduly affected by the high volatil- ity in the forex market, the RBI has also directed banks to compute the export credit limits of borrowers in such a way that exporters would be insulated from rupee volatility. It has suggested that banks calculate the overall export credit limits on an on-going basis, say, monthly, non-exportable portion, banks are re- quired to charge commercial rate of in- terest applicable to the domestic advance from the date of advance of packing credit and that portion of the packing credit would not be eligible for any refi- nance from RBI. The government now allows pre-ship- ment finance to exporters of all the 161 tradable services covered under the General Agreement on Trade in Services (GATS) where payment for such services is received in free foreign exchange as stated in FTP 2009-14. based on the prevalent position of cur- rent assets, liabilities and exchange rates, and reallocate the limit towards export credit in foreign currency. “This may re- sult in increasing or decreasing the rupee equivalent of the foreign currency com- ponent of export credit,” the RBI states. LIQUIDATION But carrots don’t come without a stick. In case an exporter is unable to tender ex- port bills of equivalent value for liquidat- ing the packing credit due to the short- fall on account of wastage involved in the processing of agro products like raw cashew nuts, etc., banks may allow ex- porters, to extinguish the excess packing credit by export bills drawn in respect of by-product like cashew shell oil, etc. However, in respect of export of agro- based products like tobacco, pepper, car- damom, cashew nuts, etc., the exporter has necessarily to purchase a somewhat larger quantity of the raw agricultural produce and grade it into exportable and non-exportable varieties and only the former is exported. The non-exportable balance is necessarily sold domestically. For the packing credit covering such PARTING NOTE Financing banks have been advised to ensure that there is no double financing and the export credit is liquidated with remittances from abroad. Banks, how- ever, have the autonomy to take into ac- count the track record of the exporter/ overseas counter party while sanctioning the export credit. Overall, Pre-shipment credit is more than mere lip-service. A scheme for the exporters and worth appreciating. FOR ADVERTISING +91-40-6677 0765/66 ads@thedollarbusiness.com www.thedollarbusiness.com shakti@thedollarbusiness.com According to the Reserve Bank of India, 16 PSBs and 10 private sector banks missed their priority sector lending targets in FY2013 78 THE DOLLAR BUSINESS II JUNE 2014
BORDERLINE EDITOR’S COLUMN It’s not for everyone. It’s for the YOU in you. Express Yourself! GO CASHLESS WITH... Your Eyewear Brand Hit that Wimble- don winning back- hand winner three seconds before noon on a rainy Sunday YOUR BANK mWALLET Your Bag Brand No more going to a cash machine. Now you don’t have to pay those extra bucks at an expensive bureau de change. No more waiting or standing in a queue. It’s the end of cash! Power up your life with ‘Your Bank’ card. It’s freedom, it’s safety... it’s power in your hands. Go cash- less. Go places. Carry your world in style! A SOJOURN YOU WON’T FORGET A rica, providing global organisations an opportunity to invest in and reap returns from. In 2012-13, when the world was scrambling to get back on its feet at a dizzy 2-3%, African countries like Chad, Niger, Sierra Leone, Ethiopia and Gha- na were galloping ahead with growth rates of 8.9%, 10.8%, 15.2%, 8.7% and 7.9% respectively. If not enough, this is in- dicative of the continent´s potential. Traditionally, businesses in Africa have behaved like ‘cat- erpillars’ – humdrum, slow-moving and easy to step on. Conditions are still somewhat similar, but change is creep- ing in fast. Although the place is still financially challenged, it’s no doubt one of the hottest markets today. While exports from Africa are growing at 6.1% (faster than any other re- gion in the world), imports are expanding even faster – twice as fast as exports – averaging 13.8% per year. Perhaps Africa is eating more than it can cook – but isn’t that a wonderful piece of news for every dollar investor? Every single country of this 54-nation bloc provides a ar- ray of opportunities to both exporters and importers. A case in point is Ethiopia. This country, situated in the Horn of Af- rica (one of the most complex and conflicted regions of the world), is an excellent example of how Africa has changed over the last 10 years (read story titled “Ethiopia – a land of promises for Indian exporters?” on page no.14 of this issue). What also charms investors is the fact that share of African suppliers in the continent’s inter-country imports (when taken as a ratio of imports from outside the continent) has been constantly falling. When it comes to India and Africa, the relationship too Coz you want to etch those moments forever Manish K. Pandey Editor, IF YOUR MORNING TEA IS INCOMPLETE WITHOUT The Dollar Business Your TV Brand THAT VIEW frica has certainly captured the world’s atten- tion. Global leaders – both business and polit- ical – are making regular and long stopovers at a land once laughed at as ‘The Dark Con- tinent.’ And it’s for a simple reason. Africa is on the verge of an economic rebirth. Statistically, many of the fastest growing economies in the world today are in Af- While exports from Africa are growing at 6.1% (faster than any other region in the world), imports are averaging 13.8% per year For that life changing TRIPSTER journey LETTING YOU ON THE SECRET BEHIND THE WAUGHS, THE CHAPPELS AND THE WOODIES Smart TV has way you see “Your Brand” change the time you to arrived. It’s generation the world. The new A blissful marriage of health and taste has entered a new era. The trade between the two nations has grown at a robust 31.8% annually over the last decade. Sounds great! But if one looks at the micro canvas, this num- ber appears small. Despite an increase in India’s exports to Africa over time, India’s share in the import basket of biggest importers in Africa is still marginal. For instance, India ac- counts for a paltry 1.7% share in Algeria’s total imports; 3% share in Angola’s total imports; 3.6% share in Egypt’s total imports; 1% share in Morocco’s total imports, 4.3% share in South Africa’s total imports, 3.4% share in Nigeria’s total im- ports, and so on. These numbers clearly narrate the Indian side of the sto- ry and what our exporters are losing out on. Any export- er with a mid-to-long term vision cannot and should not overlook Africa. You ask – what can he export? Anything from healthcare and pharmaceuticals to textiles, from auto- mobiles, including auto-components, to metals & minerals, from IT & ITeS to financial services, to energy and infra- structure – the biggest product categories when it comes to African imports. Africa is the fastest growing continent in the world. And perhaps you didn’t know about this in all the crosstalk about India and China – it’s also the youngest in the world, with 50% of its 1.1 billion inhabitants under the age of 19! The next time you think about Africa, don’t think of dark- ness. It’s that young continent, where the sun is bright and consumers are forever growing in count. Africa – it’s not about “Why?”; it’s about “Why NOT?!?” Your though, it means millions of dollars of consignements. And a lifetime of trust. Cruising on a cargo ship and weighing in with the freight can be fun. For us There is no fun without safety. Not in this lifetime. diamond Brand Your Airline Brand Diamonds can’t be priceless. Your celebrations are. A Your logistics brand diamond can’t sparkle. Your relationship Your bank brand can. Enjoy the most secure banking The banker to evry Indian makes a prom- ise it doesn’t break. The people depicted in this advertisement are Your Bank’s genuine customers. You may be next. Enjoy food. Fine dine. World-class service. Feel pampered. You’re worth every second you spend with us. Be our guest. www.your_airline_brand.com www.your_bank_brand.in Your PSU Brand Your denim brand try’s foreign trade with the overall economic growth. We are there with you from the very WE HELP YOU MAKE YOUR PLAN OF GOING OVERSEAS A SUCCESS! We have a mandate to not just enhance exports from India, but also to integrate the coun- moment you think of setting up a shop outside the country. We are your trusted partner. LOVE. NEED. WANT. You wanted to see the change. We only gave you the power of innovation. With a touch of technology. It’s your idea! Your technology Brand Some sell denims by using half-nude female first grade. It’s the power of Ima‘jean’ation! models dancing in the dead wake of a night. We do it by using shapes you learnt in your Give wings to your dreams with... Let’s pull together and get it done. YOUR SHOE BRAND Walk in style this summer. Footwear for the diva in you... @MK_Pandey www.thedollarbusiness/blogs/manish 80 THE DOLLAR BUSINESS II JUNE 2014