Download
1 / 45
460 likes | 664 Vues
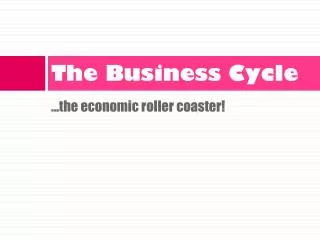
Unemployment and the Business Cycle. Contraction. Recovery/Expansion. Trough. Peak. Labor Force. Labor force – total number employed + unemployed adult workers Complete pool of U.S. workers Who qualifies for the labor force? Adult Non-Institutionalized Civilian Population

E N D
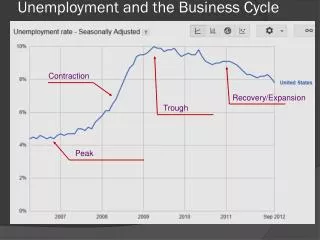
Unemployment and the Business Cycle Contraction Recovery/Expansion Trough Peak
Labor Force • Labor force – total number employed + unemployed adult workers • Complete pool of U.S. workers • Who qualifies for the labor force? • Adult Non-Institutionalized Civilian Population • Over the age of 16 • Not in the military • Not in jail or prison • Not living permanently in nursing homes, or in an other “institution”.
Labor Force • Who is not in the labor force? • Children under 16 • Full-time student (not looking for a job) • Homemaker • Retiree • Jailed Person or other “institution” • Military personnel
Employed • Employed – number of adult civilians (over 16) who are working and on a payroll of some type. • Full-time and part-time workers • Business owners (entrepreneurs sole proprietors) • Unpaid workers in a family business • People on a leave of absence (maternity, illness, etc.)
Unemployed • Unemployed – adults that are not working but are actively seeking work • Looking for work within the past 4 weeks
Types of Unemployment Frictional Seasonal Structural Cyclical
Types of Unemployment • Frictional Unemployment – caused by movement in the economy. It is always present in the economy, resulting from temporary transitions made by workers and employers • When people move in order to find a job • Someone graduates and looks for a job • Stay at home parent goes back to work
Types of Unemployment • Seasonal Unemployment – occurs as a result of seasonal change or when industries slow or shut down for a season • Summer Waves lifeguard (no winter waves) • Santa during the holidays • UPS workers during busy holiday season
Types of Unemployment • Structural Unemployment – jobs that are permanently lost; workers skill do not match the jobs that are available or in demand • Jobs that no longer exist, are not coming back • Building a new economic structure • Machines replacing workers • Jobs sent to other countries (outsourcing)
Types of Unemployment • Cyclical Unemployment – rises during economic downturns and falls when the economy improves (caused by changes in the business cycle) • Contractions – unemployment rises • Expansion – unemployment falls
Labor Force • LF = E + U • 2012, labor force (in millions), 141.2 (E) + 12.8(U) = 154 (LF) • Unemployment Rate – number of unemployed divided by the labor force multiplied by 100 • U/LF X 100 • Unemployment rate = (12.8/154) X 100 = 7.8% • Labor-force participation rate – percentage of the adult population that is in the labor force • Labor-force participation rate = LF/AP X 100 • January 2012,labor-force participation rate = (154/243) X 100 = 64%
Natural Rate of Unemployment • Natural rate of unemployment – unemployment rate of 5 to 6 percent is considered a normal/healthy economy • July 2008 – 5.8% • The unemployment rate in the United States was last reported at 8.3 percent in January of 2012 • From 1948 until 2010 the United States' Unemployment Rate averaged 5.70 percent reaching an historical high of 10.80 percent in November of 1982 and a record low of 2.50 percent in May of 1953.
Full Employment • Full Employment – is at the natural rate of unemployment, 5-6% • Zero unemployment is not an achievable goal • Unemployment rate in the early 2000’s, 3.8% was indication of economy dealing with inflationary conditions; over-performing economy
Underemployed and Discouraged Workers • Underemployed Workers – working at a job for which one is overqualified, or working part-time when full-time work is desired • Discouraged workers – a person who wants a job, but has given up looking (do not count against unemployment rate) • Dropped out of the labor force (retired, living with parents, back to school, etc.)
Video – Types of Unemploymenthttp://www.youtube.com/watch?v=Ulu3SCAmeBA&list=PL2914757C7B6E3C9A&index=9&feature=plpp_video
Video – Hedge Fund to Pizza Deliveryhttp://www.youtube.com/watch?v=teXPMVg-4q4&list=PL2914757C7B6E3C9A&index=1&feature=plpp_video
Calculating Unemployment http://www.youtube.com/watch?v=Zi3APBJuxZU&list=PL2914757C7B6E3C9A&index=22&feature=plpp_video
Unemployment Rate Cartoon • http://www.youtube.com/watch?v=DnL7Br8gc3Q
Unemployment Examples [No. While he is not working, he is also not looking for work.] • Is your retired grandfather unemployed? • Is a woman that stays home with her kids unemployed? • A thief serving time in prison lost his job when he was convicted. Is he unemployed? • An aunt serving in the Armed Forces is posted in Iraq. Is she employed? • Is a full-time college student who is looking for a job unemployed? • Are you unemployed? [No. While she may not be working outside the home, she is also not looking for work.] [No. Those serving time in prison are not in the adult population and hence not in the labor force.] [No. She is not a member of the civilian labor force because she serves in the military] [Yes, they actively looking for a job and thus counted in the labor force.] [Depends on individual situations.]
Types of Unemployment Chart Cyclical Unemployment Frictional Frictional Structural Cyclical Cyclical Structural Seasonal
Use the following formula to calculate the unemployment rate: Unemployment rate = Number of people unemployed X100 labor force 1. 2006, the number of people unemployed = 9.4 million Number of people in the civilian labor force = 147.1 million _________ ÷ _________ = _________ _________ x 100 = __________ .064 9.4 147.1 .064 6.4% 2. In 2012, the number of people unemployed = 15.2 million Number of people in the civilian labor force = 156.2 million _________ ÷ _________ = _________ _________ x 100 = __________ Calculating the unemployment rate .097 15.2 156 9.7% .097
Review - Unemployment Statistics The country of Ecolandhas collected the following information: Adult Population 240,000 Employed 180,000 Unemployed 30,000 Determine the following: 1. Labor Force = __________ + _______ = _____________ 2. Unemployment rate = (_________/_________) X 100% = ______ 3. Labor-force participation rate = (_______/_______) X 100% = _______ 180,000 30,000 210,000 30,000 210,000 14.3% 210,000 240,000 87.5%
What can cause unemployment to remain high? • Unemployment Checks • Minimum wage • Unions and Collective Bargaining • Efficiency Wages
Public Policy and Causes of Unemployment • Unemployment insurance - government program partially protects workers’ incomes when they become unemployed • Eligible – people who are laid off through no fault of their own • Ineligible – people who quit, were fired for cause, or just entered the labor force • Argument against U.I. is that it Increases frictional unemployment
99ers Video • http://www.youtube.com/watch?v=CwpdGyIY2fQ&list=PL2914757C7B6E3C9A&index=7&feature=plpp_video
Life and Death of Ashboro • http://www.youtube.com/watch?v=GkMUFBNsJr4&list=PL2914757C7B6E3C9A&index=19&feature=plpp_video
Minimum-Wage Laws • Minimum-wage laws can cause unemployment • Forces the wage to remain above the equilibrium level • Increases the quantity of labor supplied • Decreases the quantity of labor demanded • Surplus of labor – unemployment
Unemployment from a wage above equilibrium level Surplus of labor = Unemployment Wage Minimum wage WE Labor supply LS LE LD 0 Quantity of Labor Labor demand
Unions and Collective Bargaining • Unions – legally recognized as representatives of workers in many industries • Address issues such as collective bargaining over wages, benefits, and working conditions for their membership • Represent their members if management attempts to violate contract provisions • Collective Bargaining - a process of negotiations between employers and the representatives of employees aimed at reaching agreements that regulate working conditions • Wage scales, working hours, training, health and safety, overtime, grievance mechanisms, etc.
Unions and Collective Bargaining • Unions raise the wage above the equilibrium level; this can lead to unintended consequence of increases in unemployment • Better off: employed workers (insiders) • Worse off: unemployed (outsiders) • May stay unemployed (increasing unemployment) • Take jobs in firms that are not unionized
Efficiency Wages • Efficiency wages – above-equilibrium wages paid by firms to increase worker productivity • Worker health - better paid workers eat a more nutritious diet healthier and more productive • Worker turnover – firm can reduce turnover among its workers by paying them a high wage • Worker quality – firm pays a high wage attracts a better pool of workers increases the quality of its workforce • Worker effort - high wages make workers more eager to keep their jobs give workers an incentive to put forward their best effort
Chapter 28 Practice Review a. What is the labor force in 2004 and 2005? Answer: 2004: 7.4 + 105.2 = 112.6 million 2005: 8.1 + 104.2 = 112.3 million b. What is the labor force participation rate in 2004 and 2005? Answer: 2004: (112.6/168.2) x 100 = 66.9% 2005: (112.3/169.5) x 100 = 66.3% c. What is the unemployment rate in 2004 and 2005? Answer: 2004: (7.4/112.6) x 100 = 6.6% 2005: (8.1/112.3) x 100 = 7.2%
Chapter 28 Practice Review d. From 2004 to 2005, the adult population went up while the labor force went down. Provide a number of explanations why this might have occurred. Answer: Earlier retirements, students staying in college longer, more parents staying at home with children, discouraged workers discontinuing their job search. e. If the natural rate of unemployment in Employment Country is 6.6 percent, how much is cyclical unemployment in 2004 and 2005? Is Employment Country likely to be experiencing a recession in either of these years? Answer: 2004: 6.6% – 6.6% = 0% 2005: 7.2% – 6.6% = 0.6% In 2004, unemployment is "normal" for Employment Country; therefore, there is no recession. However, in 2005, unemployment is above normal (positive cyclical unemployment), so Employment Country may be in a recession.
Due Today – 11-14 • Mankiw Practice Review Worksheet • Identifying Unemployment • Understating Unemployment • Daily Tens • Notes • Terms Chapter 28
Please include on test • Name • Date – 11-13 • Class Period • Chapter 28 Test • ID: A, B, C
Extra Credit • Give a scenario of someone that would be eligible for unemployment checks; what would disqualify someone from eligibility? • Draw a supply and demand graph showing how the minimum wage causes unemployment. Explain your interpretation of the political cartoon (Illustrator’s message, symbols etc.)