Download
1 / 97
970 likes | 992 Vues
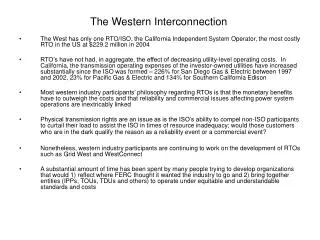
This study provides recommendations for the Energy-Water-Climate Change scenario, focusing on climate change impacts on the Western Interconnection in 2034. The report includes a literature review, recommended inputs, and implications for transmission planning.

E N D
Climate Change Impacts on the Western Interconnection Recommendations for WECC’s Energy-Water-Climate Change Scenario Dr. Fritz Kahrl Nick Schlag Conleigh Byers Sheridan Grant Arne Olson November 2, 2015
Study background • WECC developing Energy-Water-Climate Change (EWCC) Scenario that incorporates climate change impacts on Western Interconnection (WI) in 2034 • WECC engaged E3 to assess potential impacts on transmission and generation systems in WI • E3 work focused on three tasks: • Review existing literature on key climate change impacts • Translate impact results from literature to EWCC inputs, where possible • Recommend additional analytical work
Report overview • Executive summary (presentation) • Background on regional climate change impact forecasts for WI • Review of electricity system impact forecasts for WI region • Conclusions and recommendations
Executive summary contents • Overview of E3 approach • Summaries by climate change impact category • Summary of recommended approach for EWCC scenario • Recommendations for additional analytical work • Implications for WECC transmission planning • Recommended reading
From WECC list, E3 created priority list… • Priority ranking based on expected impact (L, M, H) and expected data availability (L, M, H) • E3 process: start with high priority items, adjust list adaptively, move down list as time and budget permit
Study focused around literature review • Review literature on: • Climate change impacts on electricity systems in WI, U.S. • Temperature dependence of generation and transmission systems • Translate impacts to recommended inputs for EWCC scenario • Recommended inputs intended to be well-grounded in literature, simple to apply, and meaningful
Recommended inputs based on range of estimates from literature • EWCC scenario based on 3°F (1.7°C) increase in average temperatures by 2034 • General approach: • Develop range of impact estimates based on literature • For climate impact studies, focus on estimates that are consistent with EWCC warming levels and time horizon • For temperature dependence studies, use EWCC warming (3°F) and multipliers from the literature to translate to total impact estimate • Select plausible input values based on range of estimates
Within WI, most impact assessment work in California and Pacific NW Public Interest Energy Research (PIER) program established California Climate Change Center in 2003; supports ongoing impact assessments, required by Governor’s Executive Order in 2008 Washington legislature supported Washington Climate Change Impacts Assessment by Climate Impacts Group (CIG, University of Washington) in 2009; Oregon legislature established Oregon Climate Change Research Institute (OCCRI) in 2007, supported Oregon Climate Assessment Report in 2010; Collaboration among WA, OR, ID on Pacific Northwest study More information: http://www.climatechange.ca.gov/climate_action_team/reports/climate_assessments.html More information: http://cses.washington.edu/cig/, http://occri.net/
Models agree on general trends, disagree on specifics Models Disagree Models Agree • Average temperature increase for Western U.S., greater in summer than winter • Heat extremes increase, cold extremes decrease • Decreases in summer precipitation in U.S. Northwest • Sea levels rise • Forest fire frequency, intensity, duration increases • Storm frequency, intensity increases • Magnitude of change in temperature extremes, temperature profiles, regional changes in temperature • Sign of annual precipitation changes (+/-), change in precipitation variability • Extent of sea level rise • Fire counts; magnitude of fire intensity and duration • Storm counts; magnitude of storm intensity and duration Model uncertainty remains a significant source of uncertainty in climate change impact analysis
Results organized around five impact categories • Describes, for each impact category: • Mechanisms through which climate change impacts occur • Key projections of climate change impacts • Recommended approach for EWCC scenario
Load: Climate impact mechanisms • Higher ambient temperatures: • Increase cooling loads • increase demand for AC in areas that don’t currently use it • require more energy to maintain room temperature in areas that do use AC • reduce efficiency of cooling devices • Reduce heating loads • require less energy to maintain room temperature • increase efficiency of heating devices • Largest cooling impacts in regions with low AC ownership (e.g., Pacific Northwest) • For electricity, heating impacts only in regions with electric heating (e.g., Pacific Northwest)
Load: Results and recommendations Key Findings: • In Pacific Northwest, significant increase in summer cooling loads, smaller decrease in winter heating loads • In California, modest increase in peak and energy demand • In rest of Southwest and Great Plains (MT, WY), limited existing analysis • Recommended approach for EWCC scenario • Pacific Northwest • Summer loads +10% • Winter loads -5% • California and Southwest • Summer loads +3% • Great Plains • No change
Thermal generation: Climate impact mechanisms (1) • Different effects on gas turbines (GTs = CTs, CCGTs) and steam turbines (STs = CCGTs, nuclear, coal) • Higher ambient temperatures: • Reduce output and efficiency for GTs • Lower air density (lowers mass flow) • Increased compressor work • Reduce output and efficiency for STs • Increased condenser pressure • Potentially lead to de-rates for STs • Related to cooling water discharge violations
Thermal generation: Climate impact mechanisms (2) • Lower precipitation: • Potentially leads to de-rates for STs • Lack of adequate water for cooling • Impacts on GTs/STs depend on technologies and site-specific conditions • Impacts on STs depend on cooling systems • Once through cooling (OTC), evaporative (wet) cooling, dry cooling • Impacts on GTs depend on inlet cooling systems
Thermal generation: Results and recommendations Key Findings: • Small incremental temperature-driven impacts • Capacity de-rate for GTs/STs likely 1-2% • Heat rate increases likely < 1% • Larger potential water-related impacts • STs vulnerable to drought conditions • Recommended approach for EWCC scenario • GT/ST performance • No change • ST water-related impacts • Consider drought scenario with 5% summer capacity de-rate for STs
Hydropower: Climate impact mechanisms • Changes in precipitation: • Influence hydro output • Directly, e.g. through changes in rainfall • Indirectly, e.g. through changes in runoff • Increasing ambient temperatures: • Increase evaporation, upstream water use • Trigger restrictions on hydro use to protect ecosystems
Hydropower: Results and recommendations Key Findings: • Significant uncertainty in climate model precipitation projections • Consensus on reduction in summer hydro generation in PNW • Southwest currently experiencing hydro de-rates due to drought • Recommended approach for EWCC scenario • Pacific Northwest • Summer hydro generation -15% • Scale winter hydro generation so annual hydro generation unchanged • Southwest • Consider drought scenario with: (1) 20% reduction in annual hydro generation in AZ, (2) 20% reduction in hydro qualifying capacity, 50% reduction in annual hydro generation in CA
Solar PV: Climate impact mechanisms • Higher ambient temperatures: • Reduce conversion efficiency and output for PV cells • Lead to inverter de-rates at very high temperatures, reducing AC output • Changes in cloud cover: • change irradiance (very uncertain)
Solar PV: Results and recommendations Key Findings: • Incremental de-rates on PV likely to be small • Around 1-2% • Temperature impacts on inverter de-rates more uncertain, coincident impacts likely to be small • Recommended approach for EWCC scenario • Solar PV performance • No change
Transmission system: Climate impact mechanisms • Higher ambient temperatures: • Increase line losses, resulting from: • Higher loads • Higher line resistance • May reduce line capacity, resulting from: • Higher resistive heating and line sag
Transmission system: Results and recommendations Key Findings: • For planning, line losses likely to be most important impact on transmission system • Other impacts may affect operations; unclear if / at what point they begin to affect planning • Recommended approach for EWCC scenario • Line losses • Ensure line losses scale with loads • Line capacity • No change
Summary of recommended approach for EWCC Case 2: Drought Year Case 1: Average Year Average Year Plus • Loads • Pacific Northwest • Summer loads +10% • Winter loads -5% • California and Southwest • Summer loads +3% • Great Plains • No change • Thermal Generation • Region-wide • 5% summer capacity de-rate for STs • Hydropower • Arizona • Annual hydro generation -20% • California • Hydro qualifying capacity -20% • Annual hydro generation -50% • Hydropower • Pacific Northwest • Summer generation -15% • Scale winter generation so annual generation unchanged
Recommendations for further analytical work • Two areas where further analysis would have greatest value: • Load forecasting • Comprehensive screen for WI, focused on temperature impacts • Requires medium-term forecasts of cooling and heating degree days for region; also important to consider heat index • Analytical framework for testing electricity system resiliency to extreme events • Scenario framework for assessing thresholds at which larger system changes occur • Benefit-cost framework for assessing investments to enhance resiliency
Implications for WECC transmission planning • EWCC currently a sensitivity case • At what point should WECC base case forecasts begin to incorporate potential climate change impacts? • How should these potential impacts be structured into load and generation forecasting?
Recommended reading (full bibliography at the end) • Auffhammer, Maximilian and AninAroonruengsawat. Hotspots of Climate-driven Increases in Residential Electricity Demand: A Simulation Exercise Based on Household Level Billing Data for California. Sacramento, CA: CEC, 2012a. • Bartos, Matthew D. and Mikhail V. Chester. “Impacts of climate change on electric power supply in the Western United States.” Nature Climate Change 5, 2015, 748-751. • Maulbetsch, John S. and Michael N. DiFilippo. Cost and Value of Water Use at Combined-Cyle Power Plants. CEC-500-2006-034. Sacramento, CA: CEC, 2006. • Northwest Power and Conservation Council (NPCC). Sixth Northwest Conservation and Electric Power Plan. Portland, OR: Northwest Power and Conservation Council, 2010. • Sale, Michael J. and Shih-Chieh Kao. Assessment of the Effects of Climate Change on Federal Hydropower: An Assessment Prepared in Response to Section 9505(c) of the SECURE Water Act of 2009. ORNL/TM-2011/251. Oak Ridge, TN: DOE, 2012. • Maulbetsch, John S. and Michael N. DiFilippo. Cost and Value of Water Use at Combined-Cyle Power Plants. CEC-500-2006-034. Sacramento, CA: CEC, 2006. • Westerling, Anthony. Climate Forecasts for Improving Management of Energy and Hydropower Resources in the Western U.S. Sacramento, CA: CEC, 2008.
Thank You! Energy and Environmental Economics, Inc. (E3)101 Montgomery Street, Suite 1600San Francisco, CA 94104Tel 415-391-5100Web http://www.ethree.com Dr. Fritz Kahrl, Managing Consultant (fritz@ethree.com)Arne Olson, Partner (arne@ethree.com)
Regional forecasts of climate change impacts rely on global climate models • Assessments of climate change impacts based on climate model forecasts • Climate models are intrinsically global — general circulation models (GCMs) that capture earth ocean-atmosphere interaction Source: https://www.wmo.int/pages/themes/climate/climate_models.php • Two general approaches to forecasting (downscaling) regional climate impacts with GCMs: • Statistical — scale local variables using GCM output and statistics • Nesting — link regional climate model (RCM) with a GCM
Many GCMs in use, differ in model design and sensitivities • Models differ in temperature and precipitation sensitivity to radiative forcing And many more…
GCMs initially driven by GHG emission scenarios Figure: Global GHG Emissions and Warming by SRES • Before 2014, Intergovernmental Panel on Climate Change (IPCC) Assessment Reports (ARs) rely on GHG emission scenarios • Emission scenarios for AR3 and AR4 developed in 2000 Special Report on Emission Scenarios (SRES) • 6 SRES scenarios Source: https://www.ipcc.ch/publications_and_data/ar4/syr/en/figure-spm-5.html
Shift to GHG concentration pathways in IPCC AR5 Figure: Global GHG Emissions and Concentrations by RCP • Representative concentration pathways (RCPs) adopted in AR5 • Link emissions, concentrations, and radiative forcing • Number in RCP represents radiative forcing level by 2100, • e.g., RCP8.5 is a 8.5 Watts per m2 forcing by 2100 • Four RCPs Source: van Vuuren et al., 2011
Some amount of warming already “committed” • “B1” and “RCP 4.5” are probably most plausible GHG emission reduction scenarios, global GHG emissions peak in ~2040 • Likely increases in global average surface temperature of 1.1-2.9°C (2.0-5.2°F) by end century* SRES GHG Emissions RCP CO2 Emissions B1 RCP4.5 * Based on IPCC AR4 “likely” range for B1 (1.1-2.9°C) and AR5 “likely” range for RCP4.5 (1.1-2.9°C)
Interpreting climate model results • GCMs typically produce time-averaged results in 30-year time horizons — focus on climate regimes rather than individual years • Studies often use multiple models and scenarios Table from Cayan et al., 2007, “Climate Change Scenarios for the California Region” 30-year horizon Multiple models Multiple scenarios
Models agree on general trends, disagree on specifics Models Disagree Models Agree • Average temperature increase for Western U.S., greater in summer than winter • Heat extremes increase, cold extremes decrease • Decreases in summer precipitation in U.S. Northwest • Sea levels rise • Forest fire frequency, intensity, duration increases • Storm frequency, intensity increases • Magnitude of change in temperature extremes, temperature profiles, regional changes in temperature • Sign of annual precipitation changes (+/-), change in precipitation variability • Extent of sea level rise • Fire counts; magnitude of fire intensity and duration • Storm counts; magnitude of storm intensity and duration Model uncertainty remains a significant source of uncertainty in climate change impact analysis
Within WI, most impact assessment work in California and Pacific NW Public Interest Energy Research (PIER) program established California Climate Change Center in 2003; supports ongoing impact assessments, required by Governor’s Executive Order in 2008 Washington legislature supported Washington Climate Change Impacts Assessment by Climate Impacts Group (CIG, University of Washington) in 2009; Oregon legislature established Oregon Climate Change Research Institute (OCCRI) in 2007, supported Oregon Climate Assessment Report in 2010; Collaboration among WA, OR, ID on Pacific Northwest study More information: http://www.climatechange.ca.gov/climate_action_team/reports/climate_assessments.html More information: http://cses.washington.edu/cig/, http://occri.net/
Review organized around impact categories • For each impact category: • Describe mechanisms governing impacts • Describe scope and nature of existing studies • Show impact estimate ranges
Climate impacts on electricity system translated via intermediate impacts • Climate change affects electricity system metrics through “impact chain” Climate change impact chain Environment response Climate change variable Electricity system impact Electricity component impact Mechanism 1: How are changes in global climate translated into changes in local environment? Mechanism 2: How are changes in environment translated into impacts on electricity components? Mechanism 3: How are changes in electricity components translated into impacts on system metrics?
Example impact chain Example: Impact of increased temperature extremes (intensity, frequency, duration of heat waves) on system reliability Reduction in air density Increase in temperature extremes Reduction in reliability Reduction in GT output Mechanism 1: Increases in temperature reduce density of air, from ideal gas law Mechanism 2: For GTs, lower air density reduces mass flow rate (ṁ) through turbine, decreases power output Mechanism 3: All else equal, reduced peak period output changes reliability metric (e.g., LOLE)
Studies focus on different parts of impact chain • Climate impact studies differ in focus, comprehensiveness Environment response Climate change variable Electricity system impact Electricity component impact Some studies focus only on T impacts, though effects may compound (e.g., heat and drought) Some studies focus more on single component, multiple impacts (e.g., temperature impact on GT output and efficiency) Some studies focus more on system impact, more than one component (e.g., impact on total WECC available capacity)
Study focused on review of existing literature • Review literature on: • Climate change impacts on WI, U.S. • Temperature dependence of generation and transmission system • Translate to recommended inputs for EWCC scenario • Recommended inputs intended to be well-grounded in literature, simple to apply, and meaningful
Recommended inputs based on ranges in literature • General approach: • EWCC scenario based on 3°F (1.7°C) increase in average temperatures by 2034 • In instances where system impact estimates exist, draw on B1 or RCP4.5 scenario results • Example: increase in peak electricity demand under a given SRES/RCP scenario in a given time horizon • Mainly useful for gauging longer-term projections; scenarios more consistent before ~2040 • In instances where component impact estimates exist, use EWCC temperature as reference • Example: decrease in gas turbine rated capacity per each degree of temperature increase • Use 1.5 multiplier (Cayan et al., 2012; Dalton et al., 2013) to convert to summer high temperature proxy (i.e., 1.7°C x 1.5 = ~2.6°C) for use where relevant
Impact category 1: Load • Focus on: • Increased summer peak and energy demand from higher summer temperatures • Decreased winter peak and energy from lower winter temperatures • Regions: Pacific Northwest, California, Southwest, Great Plains
Climate change increases cooling, reduces heating needs Increased Cooling Needs Decreased Heating Needs • Higher energy required to maintain same room temperature during summer • Cooling device efficiency decreases at higher temperatures • Affects multiple cooling loads, but primarily air conditioning • Impacts summer peak capacity and total energy needs • Less energy required to maintain same room temperature during winter • Heating devices more efficient at warmer temperatures • Affects multiple heating loads, but primarily space heating • Impacts winter peak capacity and total energy needs
Forecasted load impacts vary across space and time • Projected temperature changes vary across seasons, time of day • Generally increases higher in daytime in hotter months; decreases higher in nighttime in colder months • Projected load impacts vary across regions • Southwest (summer peaking) • Higher summer peak, energy demand • Potentially longer peak load, spreading to spring, autumn (Lu et al., 2008) • Pacific Northwest (winter peaking) • Higher summer peak, energy demand • Lower winter peak, energy demand (summer increase greater than winter decrease) • No impact studies for Great Plains (MT, WY)
Different approaches to analyzing load impacts • Three main kinds of studies: • Regression, using historical system loads and cooling/heating degree day projections (“regression aggregate”) • Regression, using disaggregated billing data (“regression disaggregate”) • Bottom-up building simulations (“building simulation”) • Focus here on studies that report percentage impact on total or customer loads (e.g., rather than cooling energy demand)