Understanding Different Types of Graphs: Pictographs, Bar Graphs, Line Graphs, and More
Learn about various types of graphs used to present and analyze data, including pictographs, bar graphs, line graphs, and circle graphs. This guide explains the essential elements of each graph type, such as axes, how to interpret data, and methods for comparison. Discover different graph styles like vertical and horizontal bar graphs, tally charts, and divided bar graphs. Understand fundamental terms like data, surveys, and comparisons, equipping you with the knowledge to effectively use and create visual data representations.

Understanding Different Types of Graphs: Pictographs, Bar Graphs, Line Graphs, and More
E N D
Presentation Transcript
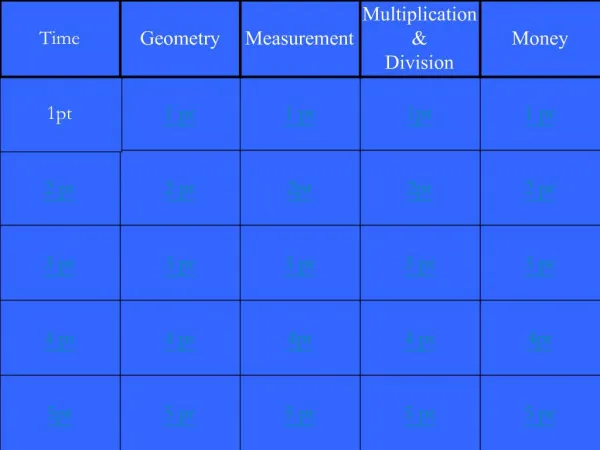
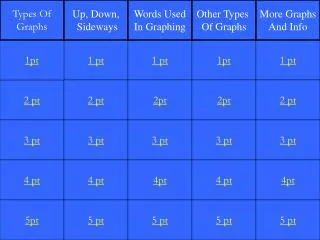
Types Of Graphs Up, Down, Sideways Words Used In Graphing Other Types Of Graphs More Graphs And Info 1pt 1 pt 1 pt 1pt 1 pt 2 pt 2 pt 2pt 2pt 2 pt 3 pt 3 pt 3 pt 3 pt 3 pt 4 pt 4 pt 4pt 4 pt 4pt 5pt 5 pt 5 pt 5 pt 5 pt
A graph that uses a line to show how data changes over a period of time.
A graph in the shape of a circle that shows data as a whole made up of different parts.
A simple picture or figure whose parts represent information.
To describe whether numbers are equal to, less than, or greater than each other.
A method of gathering information by talking or writing.
A bar graph that has bars going up from the bottom.
A bar graph in which the bars go from left to right.
Drawing or diagram used to record information.
Paper marked with regular vertical and horizontal lines, used for graphing.
What is grid paper or graphing paper?
A bar divided to show proportions of the total.
A graph that increases in steps rather than a line.