Download
1 / 23
230 likes | 349 Vues
Magnitude 9.0 NEAR THE EAST COAST OF HONSHU, JAPAN Friday, March 11, 2011 at 05:46:23 UTC . Japan was struck by a magnitude 9.0 earthquake off its northeastern coast Friday. This is one of the largest earthquakes that Japan has ever experienced. . .

E N D
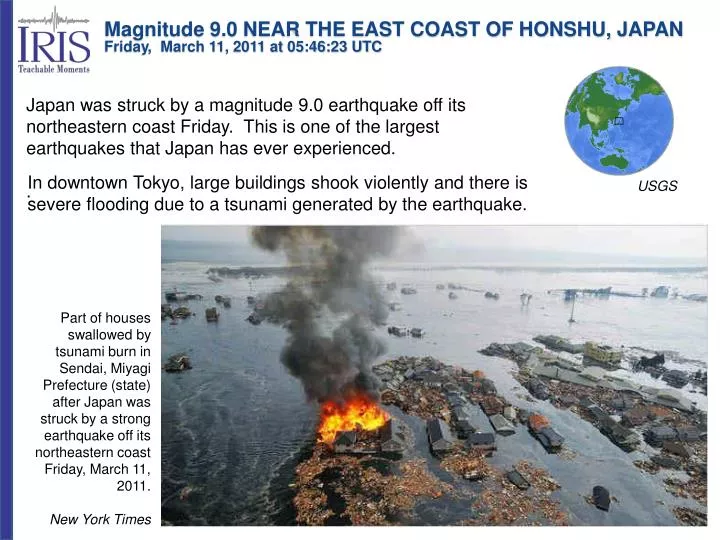
Magnitude 9.0 NEAR THE EAST COAST OF HONSHU, JAPANFriday, March 11, 2011 at 05:46:23 UTC Japan was struck by a magnitude 9.0 earthquake off its northeastern coast Friday. This is one of the largest earthquakes that Japan has ever experienced. . In downtown Tokyo, large buildings shook violently and there is severe flooding due to a tsunami generated by the earthquake. USGS Part of houses swallowed by tsunami burn in Sendai, Miyagi Prefecture (state) after Japan was struck by a strong earthquake off its northeastern coast Friday, March 11, 2011. New York Times
Magnitude 9.0 NEAR THE EAST COAST OF HONSHU, JAPANFriday, March 11, 2011 at 05:46:23 UTC Tsunami waves swept away houses and cars in northern Japan and pushed ships aground. The tsunami waves traveled far inland, the wave of debris racing across the farmland, carrying boats and houses with it. The tsunami, seen crashing into homes in Natori, Miyagi prefecture. AP Houses were washed away by tsunami in Sendai, Miyagi Prefecture in eastern Japan, after Japan was struck by a magnitude 9.0 earthquake off the northeastern coast. New York Times
Magnitude 9.0 NEAR THE EAST COAST OF HONSHU, JAPANFriday, March 11, 2011 at 05:46:23 UTC CNN reported “The quake rattled buildings and toppled cars off bridges and into waters underneath. Waves of debris flowed like lava across farmland, pushing boats, houses and trailers toward highways.” Additionally, a number of fires broke out including one at an oil refinery which at this time, is burning out of control. Giant fireballs rise from a burning oil refinery in Ichihara, Chiba Prefecture (state) after Japan was struck by a strong earthquake off its northeastern coast Friday, March 11, 2011. Los Angeles Times
Magnitude 9.0 NEAR THE EAST COAST OF HONSHU, JAPANFriday, March 11, 2011 at 05:46:23 UTC This earthquake occurred 130 km (80 miles) east of Sendai, Honshu, Japan and 373 km (231 miles) northeast of Tokyo, Japan. Images courtesy of the US Geological Survey
Magnitude 9.0 NEAR THE EAST COAST OF HONSHU, JAPANFriday, March 11, 2011 at 05:46:23 UTC Shaking intensity scales were developed to standardize the measurements and ease comparison of different earthquakes. The Modified-Mercalli Intensity scale is a twelve-stage scale, numbered from I to XII. The lower numbers represent imperceptible shaking levels, XII represents total destruction. A value of IV indicates a level of shaking that is felt by most people. Perceived Shaking Extreme Violent Severe Very Strong Strong Moderate Light Weak Not Felt Modified Mercalli Intensity Image courtesy of the US Geological Survey USGS Estimated shaking Intensity from M 9.0 Earthquake
Magnitude 9.0 NEAR THE EAST COAST OF HONSHU, JAPANFriday, March 11, 2011 at 05:46:23 UTC USGS PAGER Population Exposed to Earthquake Shaking The USGS PAGER map shows the population exposed to different Modified Mercalli Intensity (MMI) levels. MMI describes the severity of an earthquake in terms of its effect on humans and structures and is a rough measure of the amount of shaking at a given location. Overall, the population in this region resides in structures that are resistant to earthquake shaking. The color coded contour lines outline regions of MMI intensity. The total population exposure to a given MMI value is obtained by summing the population between the contour lines. The estimated population exposure to each MMI Intensity is shown in the table below. Image courtesy of the US Geological Survey
Magnitude 9.0 NEAR THE EAST COAST OF HONSHU, JAPANFriday, March 11, 2011 at 05:46:23 UTC Globally, this is the 4th largest earthquake since 1900. Chile 1960 Alaska 1964 Sumatra 2004 Russia 1952 Japan 2011 Ecuador 1906 Chile 2010 Alaska 1965
Magnitude 9.0 NEAR THE EAST COAST OF HONSHU, JAPANFriday, March 11, 2011 at 05:46:23 UTC Peak ground acceleration is a measure of violence of earthquake ground shaking and an important input parameter for earthquake engineering. The force we are most experienced with is the force of gravity, which causes us to have weight. The peak ground acceleration contours on the map are labeled in percent (%) of g, the acceleration due to gravity. Map showing measured Peak Ground Accelerations across Japan measured in percent g (gravity). Image courtesy of the US Geological Survey
Magnitude 9.0 NEAR THE EAST COAST OF HONSHU, JAPANFriday, March 11, 2011 at 05:46:23 UTC Earthquake and Historical Seismicity This earthquake (gold star), plotted with regional seismicity since 1990, occurred at approximately the same location as the March 9, 2011 M 7.2 earthquake. In a cluster, the earthquake with the largest magnitude is called the main shock; anything before it is a foreshock and anything after it is an aftershock. A main shock will be redefined as a foreshock if a subsequent event has a larger magnitude. This earthquake redefines the M 7.2 earthquake as a foreshock, with this event replacing it as the main shock. Image courtesy of the US Geological Survey
Magnitude 9.0 NEAR THE EAST COAST OF HONSHU, JAPANFriday, March 11, 2011 at 05:46:23 UTC This earthquake was the result of thrust faulting along or near the convergent plate boundary where the Pacific Plate subducts beneath Japan. This map also shows the rate and direction of motion of the Pacific Plate with respect to the Eurasian Plate near the Japan Trench. The rate of convergence at this plate boundary is about 83 mm/yr (8 cm/year). This is a fairly high convergence rate and this subduction zone is very seismically active. Japan Trench
Magnitude 9.0 NEAR THE EAST COAST OF HONSHU, JAPANFriday, March 11, 2011 at 05:46:23 UTC The map on the right shows historic earthquake activity near the epicenter (star) from 1990 to present. As shown on the cross section, earthquakes are shallow (orange dots) at the Japan Trench and increase to 300 km depth (blue dots) towards the west as the Pacific Plate dives deeper beneath Japan. Seismicity Cross Section across the subduction zone showing the relationship between color and earthquake depth. Images courtesy of the US Geological Survey
Magnitude 9.0 NEAR THE EAST COAST OF HONSHU, JAPANFriday, March 11, 2011 at 05:46:23 UTC At the latitude of this earthquake, the Pacific plate moves approximately westwards with respect to the Eurasian plate at a velocity of 83 mm/yr. The Pacific plate thrusts underneath Japan at the Japan Trench, and dips to the west beneath Eurasia. The location, depth, and focal mechanism of the March 11 earthquake are consistent with the event having occurred as thrust faulting associated with subduction along this plate boundary. Shaded areas show quadrants of the focal sphere in which the P-wave first-motions are away from the source, and unshaded areas show quadrants in which the P-wave first-motions are toward the source. The dots represent the axis of maximum compressional strain (in black, called the "P-axis") and the axis of maximum extensional strain (in white, called the "T-axis") resulting from the earthquake. USGS Centroid Moment Tensor Solution
Magnitude 9.0 NEAR THE EAST COAST OF HONSHU, JAPANFriday, March 11, 2011 at 05:46:23 UTC Large earthquakes involve slip on a fault surface that is progressive in both space and time. This “map” of the slip on the fault surface of the M 9.0 Japan earthquake shows how fault displacement propagated outward from an initial point (or focus) about 24 km beneath the Earth’s surface. The rupture extended over 500 km along the length of the fault, and from the Earth’s surface to depths of over 50 km. Image courtesy of the U.S. Geological Survey Cross-section of slip distribution. The strike direction of the fault plane is indicated by the black arrow and the hypocenter location is denoted by the red star. The slip amplitude are showed in color and motion direction of the hanging wall relative to the footwall is indicated by black arrows. Contours show the rupture initiation time in seconds.
Magnitude 9.0 NEAR THE EAST COAST OF HONSHU, JAPANFriday, March 11, 2011 at 05:46:23 UTC Although magnitude is still an important measure of the size of an earthquake, particularly for public consumption, seismic moment is a more physically meaningful measure of earthquake size. Seismic moment is proportional to the product of the slip on the fault and the area of the fault that slips. This graph of the moment rate function describes the rate of moment release with time after earthquake origin. The largest amounts of rupture occurred over 100 seconds but smaller displacements continued for another 75 seconds after the start of the earthquake. Image courtesy of the U.S. Geological Survey
Magnitude 9.0 NEAR THE EAST COAST OF HONSHU, JAPANFriday, March 11, 2011 at 05:46:23 UTC The moment magnitude scale is designed to give an accurate characterization of the true size of an earthquake, but be tied to the original description of magnitude that was developed by Charles Richter.Moment magnitude accounts for earthquake size by looking at all the energy released. It is striking that only 6 earthquakes over the last 106 years account for over half of the energy released during that time. New Mexico Institute of Mining and Technology
Magnitude 9.0 NEAR THE EAST COAST OF HONSHU, JAPANFriday, March 11, 2011 at 05:46:23 UTC This earthquake was preceded by a series of large foreshocks over the previous two days, beginning on March 9th with an M 7.2 event approximately 40 km from the March 11 earthquake, and continuing with 3 earthquakes greater than M 6 on the same day. The M 9.0 earthquake has been followed by frequent large aftershocks, which can do damage on their own especially to buildings that were compromised in the main shock. The M 9.0 main shock (red star) is plotted with 14 aftershocks larger than magnitude 6.0 that occurred in the first 6 hours after the earthquake. This includes a magnitude 7.1.
Magnitude 9.0 NEAR THE EAST COAST OF HONSHU, JAPANFriday, March 11, 2011 at 05:46:23 UTC Aftershocks Aftershock sequences follow predictable patterns as a group, although the individual earthquakes are themselves not predictable. The graph below shows how the number of aftershocks and the magnitude of aftershocks decay with increasing time since the main shock. The number of aftershocks also decreases with distance from the main shock. Aftershocks usually occur geographically near the main shock. The stress on the main shock's fault changes drastically during the main shock and that fault produces most of the aftershocks. Sometimes the change in stress caused by the main shock is great enough to trigger aftershocks on other, nearby faults. Image and text courtesy of the US Geological Survey
Magnitude 9.0 NEAR THE EAST COAST OF HONSHU, JAPANFriday, March 11, 2011 at 05:46:23 UTC Locations of NOAA’s National Data Buoy Center (NDBC) DART stations comprising the operational network. Tsunami monitoring systems have been strategically deployed near regions with a history of tsunami generation, to ensure measurement of the waves as they propagate towards coastal communities and to acquire data critical to real-time forecasts.
Magnitude 9.0 NEAR THE EAST COAST OF HONSHU, JAPANFriday, March 11, 2011 at 05:46:23 UTC Shallow great earthquakes in subduction zones often cause tsunamis when they offset the ocean floor. This offset generates tsunami waves. This earthquake did produce a tsunami, which was measured on a nearby buoy and triggered the warning system. The water column height change that triggered the system. Flash animation of how the DART system detects ocean waves
Magnitude 9.0 NEAR THE EAST COAST OF HONSHU, JAPANFriday, March 11, 2011 at 05:46:23 UTC The DART II® system consists of a seafloor bottom pressure recording (BPR) system capable of detecting tsunamis as small as 1 cm, and a moored surface buoy for real-time communications. DART II has two-way communications between the BPR and the Tsunami Warning Center (TWC) using the Iridium commercial satellite communications system. The two-way communications allow the TWCs to set stations in event mode in anticipation of possible tsunamis or retrieve the high-resolution (15-s intervals) data in one-hour blocks for detailed analysis. DART II systems transmit standard mode data, containing twenty-four estimated sea-level height observations at 15-minute intervals, once very six hours. NOAA
Magnitude 9.0 NEAR THE EAST COAST OF HONSHU, JAPANFriday, March 11, 2011 at 05:46:23 UTC This tsunami propagation forecast model shows the forecast maximum tsunami wave height (in cm). Ocean floor bathymetry affects the wave height because a tsunami moves the seawater all the way to the floor of the ocean. This led to a Pacific wide tsunami warning being issued.
Magnitude 9.0 NEAR THE EAST COAST OF HONSHU, JAPANFriday, March 11, 2011 at 05:46:23 UTC Projected travel times for the arrival of the tsunami waves across the Pacific. Nearby the earthquake there are only minutes to evacuate. However, in many other regions there is advance warning. A tsunami map shows projected travel times for the Pacific Ocean. This map indicates forecasted times only, not that a wave traveling those distances has actually been observed.. NOAA
Magnitude 9.0 NEAR THE EAST COAST OF HONSHU, JAPANFriday, March 11, 2011 at 05:46:23 UTC Seismic waves recorded around the world.