Download
1 / 15
150 likes | 319 Vues
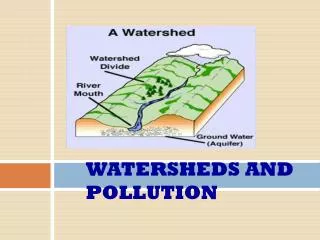
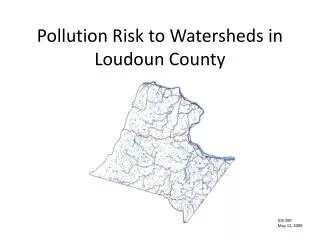
Pollution Risk to Watersheds in Loudoun County. GIS 200 May 11, 2009. Goal. Use GIS to evaluate the risk of water pollution in Loudoun County, VA watersheds.

E N D
Pollution Risk to Watersheds in Loudoun County GIS 200 May 11, 2009
Goal • Use GIS to evaluate the risk of water pollution in Loudoun County, VA watersheds. • Determining the area or areas at greater risk can be used to help target watershed areas for monitoring and pollution prevention efforts. • Use data on pollution sources to compare the number of sources by watershed in Loudoun County. • The more sources in a watershed could mean a greater risk to that watershed.
Data • Collected data on watersheds, location of surface water, and pollution sources. Data Sources: • Loudoun County from the NVCC GIS server • Facilities and sites subject to environmental regulation downloaded from the US EPA’s website www.epa.gov/enviro/geo_data.html • Virginia Department of Environmental Quality (VA DEQ) Final 2008 305(b)/303(d) Water Quality Assessment Integrated Report downloaded from the VA DEQ’s website www.deq.virginia.gov/wga/ir2008.html • The Loudoun County data used the projected coordinate system NAD 1983 HARN State Plane Virginia North FIPS 4501 Feet. • The US EPA and VA DEQ data needed to be converted from NAD 83 into NAD 83 HARN. Then projected using NAD 1983 HARN State Plane Virginia North FIPS 4501 Feet.
Analysis • Exported the Loudoun County Major Watersheds Feature Class to a shapefile. • Used this shapefile to clip the shapefiles from the US EPA and the VA DEQ. • Dissolved the Major Watersheds shapefile. • Used this shapefile to join spatially with other Loudoun County data, US EPA data, and the VA DEQ data to create choropleth maps.
Major Watersheds inLoudoun County • Broad Run • Bull Run • Catoctin Creek • Clarks Run • Direct to Potomac • Dutchman Creek • Goose Creek • Limestone Branch • Piney Run • Quarter Branch • Sugarland Run
Facilities and Sites Subject to US EPA Environmental Regulation
Conclusions • Goose Creek and Catoctin Creek watersheds had the largest number of pollution point sources. • Broad Run watershed had the largest number of stormwater outfalls. • Broad Run watershed had the largest number of sites subject to US EPA regulations. • Goose Creek watershed had the largest number of impaired streams and rivers based on the VA DEQ report.
Conclusions • Goose Creek watershed would be at greatest risk to water pollution and therefore the best areas to concentrate monitoring and pollution prevention efforts. • Catoctin Creek and Broad Run watersheds would also be worth consideration.
Suggestions for Further Research • Identifying the possible impact of roads and pollution sources based on their proximity to water bodies. I was unable to use this analysis using the data I had collected however they may be other data available that would improve this analysis. • Additional spatial analysis could also be performed using water quality monitoring data, drainage lines, flood zones, and zoning.
References • EPA Geospatial Data Access Project. Retrieved April 13, 2009 from US EPA website www.epa.gov/enviro/geo_data.html. • Final 2008 305(b)/303(d) Water Quality Assessment Integrated Report (Integrated Report) GIS data (2008). Retrieved April 13, 2009, from Virginia Department of Environmental Quality website www.deq.virginia.gov/wga/ir2008.html. • Loudoun County GIS Data. Retrieved April 13, 2009, from NVCC GIS Server \\NVSTU-resgis01\Loudoun_2Qtr_2007.