Download
1 / 17
170 likes | 285 Vues
Explore validated long-range lightning detection methods with high accuracy for various weather events using satellite mapping studies. Enhance flash detection efficiency with proximity to coastlines and sensor additions.

E N D
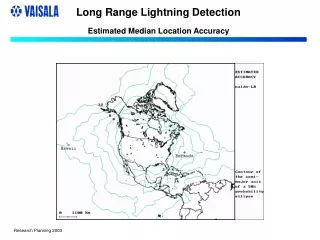
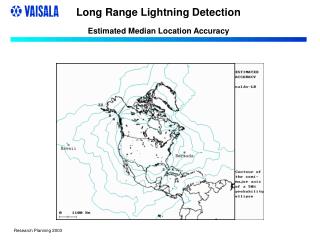
Long Range Lightning DetectionEstimated Median Location Accuracy
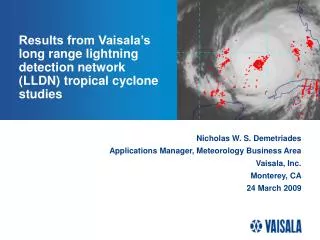
LOCATION ACCURACY VALIDATION • Verified using LIS satellite mapper in a Study by Boeck et al., (Fall AGU Meeting, 1999) • Verified in a Transcontinental study using the NLDN (Cramer and Cummins, ICAE 1999)
Long Range Lightning DetectionBest-case Detection (nighttime propagation)
FLASH DETECTION EFFICIENCY • Flash Detection Efficiency DECREASES with range from U.S./Canada (NLDN/CLDN only) • ~ 90% near coastline (day/night) • ~ 10% at 2000 km from coastline (day) • ~ 10% at 3200 km from coastline (night) • Can improve significantly with the addition of sensors information from other countries
Sea-level Pressure Map at 9 UTC (left panel) and Cloud-to-ground Lightning Detected between 6 and 9 UTC (right panel) 25 December 2002. Central Pressure - 997 mb Lightning Triggered by Upper-Level Impulse
Sea-level Pressure Map at 12 UTC (left panel) and Cloud-to-ground Lightning Detected between 9 and 12 UTC (right panel) 25 December 2002. Central Pressure - 993 mb Pressure Tendency - - 4 mb over 3 hrs Lightning Near Deepening Low Center
Sea-level Pressure Map at 18 UTC (left panel) and Cloud-to-ground Lightning Detected between 15 and 18 UTC (right panel) 25 December 2002. Central Pressure - 979 mb Pressure Tendency - - 7 mb over 3 hrs
Sea-level Pressure Map at 12 UTC (left panel) and Long Range Cloud-to-ground Lightning Detected between 0852 and 1152 UTC (right panel) 18 December 2002. Downstream Convection, some Lightning near Low Center
Sea-level Pressure Map at 18 UTC (left panel) and Long Range Cloud-to-ground Lightning Detected between 1453 and 1753 UTC (right panel) 18 December 2002.
Sea-level Pressure Map at 6 UTC (left panel) and Long Range Cloud-to-ground Lightning Detected between 0253 and 0553 UTC (right panel) 19 December 2002. Central Pressure - 980 mb Pressure Tendency - - 4 mb over 3 hrs
Sea-level Pressure Map at 12 UTC (left panel) and Long Range Cloud-to-ground Lightning Detected between 0853 and 1153 UTC (right panel) 16 February 2003. Cold Front Convection
Sea-level Pressure Map at 15 UTC (left panel) and Long Range Cloud-to-ground Lightning Detected between 1153 and 1453 UTC (right panel) 16 February 2003.
Sea-level Pressure Map at 18 UTC (left panel) and Long Range Cloud-to-ground Lightning Detected between 1453 and 1753 UTC (right panel) 16 February 2003. 2-4 Feet of Snow in New England with Low Pressure remaining above 1000 mb