Download
1 / 28
310 likes | 374 Vues
This presentation explores the school-to-prison pipeline, its causes, and the impact of exclusionary discipline practices. It delves into zero-tolerance policies, high-stakes testing, racial disparities, and the influence of socioeconomic status and disabilities on this issue.

E N D
The School-to-Prison Pipeline Your Name, Title Audience, Location March 1, 2016
Overview of the Presentation • What is the “school-to-prison pipeline”? • What are school-based/mandatorily reported offenses? • What factors contribute to the school-to-prison pipeline? • What are the national/NC suspension statistics? • What are the national/NC suspension trends? • Is there a correlation between suspensions and juvenile justice involvement?
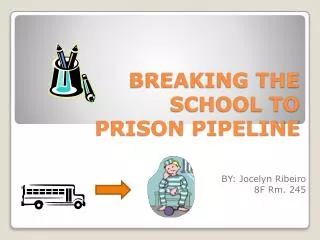
What is the School-to-Prison Pipeline (STPP)? The school-to-prison pipeline refers to the pathway between the education and juvenile or adult criminal justice system. http://www.apa.org/pubs/info/reports/zero-tolerance.pdf
What are school-based/mandatorily reported offenses? “an offense that occurs on school grounds, school property (e.g., busses), at a school bus stop, or at an off-campus school-sanctioned event (e.g., field trips, athletic competitions) or whose victim is a school (such as a false bomb report)” http://www.ncdjjdp.org/resources/pdf_documents/annual_report_2007.pdf
NC Mandatorily Reported Offenses 01 – Assault Resulting in Serious Injury 02 – Assault Involving Use of a Weapon 03 – Assault on School Personnel 04 – Bomb Threat 05 – Burning of a School Building 06 – Death by Other Than Natural Causes 07 – Kidnapping 08 – Possession of an Alcoholic Beverage 09 – Possession of a Controlled Substance in Violation of the Law 10 – Possession of a Firearm or Powerful Explosive 11 – Possession of a Weapon 12 – Rape 13 – Robbery with a Dangerous Weapon (Armed Robbery) 15 – Sexual Assault (Not Involving Rape or Sexual Offense) 16 – Sexual Offense 17 – Taking Indecent Liberties with a Minor
Zero-Tolerance Policies “Zero-tolerance” policies are those used to convey a predetermined set of consequences, often punitive, without consideration of offense severity, mitigating circumstances, or context (APA, 2008). 94% of U.S. public schools have implemented some zero -tolerance policy. Although suspending youth using zero-tolerance was intended to improve school safety, the number of student problem behaviors and dropouts actually increased in a 2006 study. http://www.apa.org/pubs/info/reports/zero-tolerance.pdf
High-Stakes Testing • 20 states offer incentives for successful schools • 19 reward improved schools, YET • 45 states punish schools as a result of testing • 27 rate/rank their schools • 14 can close, reconfigure, take over low-performing schools • 16 can replace teachers & • 11 can revoke a school’s accreditation based on students’ test results. High-stakes testing relies on standardized testing to assess school performance and enforce accountability (Advancement Project, 2010).
Exclusionary Discipline Exclusionary discipline is defined as any discipline strategy that excludes students from actual/regular instruction. Examples include: ISS (in school suspension) and OSS (out of school suspension).
Race - Race has been defined as historically provisional social constructs or characterizations (Bobo & Fox, 2003) that most often categorize people based on physical characteristics such as skin color, bone structure, hair type or eye color. Ethnicity- Ethnicity refers to a group with a shared heritage such as nationality, culture, language, religion, etc. The U.S. Census Bureau suggests that federal agencies use a minimum of two, such as: Hispanic or Latino and Not Hispanic or Latino.
Sex/Sexual Identity • Despite demonstrating no greater academic or behavior problems or engagement in illegal activity, nonhetero-sexual and non-cisgenderyouth are disproportionately suspended, expelled, and arrested (Himmlestein& Bruckner, 2011).
Socioeconomic Status (SES) • Students eligible for free/reduced school lunch programs are at greater risk of being suspended than their wealthier peers(Verdugo & Glenn, 2006). • However, in “The Color of Discipline: Sources of Racial and Gender Disproportionality in School Punishment” Skiba et al. (2002) found that the effects of socio-economic status are much less robust than those of race and gender. http://indiana.edu/~equity/docsColorofDiscipline2002.pdf
Disability/ Mental Health When compared to students without a disability, students diagnosed with a disability are: • At a greater risk of exclusionary discipline • Suspended twice as often • 75% more likely to be expelled http://www.indiana.edu/~equity/docs/discipline_disability_race_indiana.pdf
US Dept. of Education - 2011/12 Public School Enrollment ocrdata.ed.gov
US Dept. of Education - 2011/12 In-School Suspensions ocrdata.ed.gov
US Dept. of Education - 2011/12 Out of School Suspensions >1 ocrdata.ed.gov
Racial differences in NC suspension rates 2008/09 by offense type (Losen, 2011) http://escholarship.org/uc/item/4q41361g
Secondary School Suspension Rates 1972/73 – 2009/10 http://civilrightsproject.ucla.edu/resources/projects/center-for-civil-rights-remedies/school-to-prison-folder/federal-reports/out-of-school-and-off-track-the-overuse-of-suspensions-in-american-middle-and-high-schools/OutofSchool-OffTrack_UCLA_4-8.pdf
Role of Discretion A 2011 longitudinal study by the Council of State Governments of almost a million youth in Texas, found that White, Hispanic, & Black students were removed from school for mandatory violations at proportionate rates But only 3% of disciplinary actions were for mandatory violations; the remainder (97%) were discretionary and were statistically significantly disproportionate http://csgjusticecenter.org/wp-content/uploads/2012/08/Breaking_Schools_Rules_Report_Final.pdf
Multivariate Analyses With almost a million youth, this study allowed researchers to compare otherwise identical White, Hispanic, and Black students committing the same behaviors and controlling for 83 distinct variables. So matched on all 83 study variables, Black students had a 31% higher likelihood of disciplinary action when compared with otherwise completely similar White and Hispanic students with the same offenses. http://csgjusticecenter.org/wp-content/uploads/2012/08/Breaking_Schools_Rules_Report_Final.pdf
Correlation between suspensions and juvenile justice involvement? Of the students who have been suspended or expelled at least once, more than 1 in 7 had subsequent contact with the JJ system. By race: • 1 in 5 Black students • 1 in 6 Hispanic students • 1 in 10 White students This is in comparison to 2% of students who received no school disciplinary action. http://csgjusticecenter.org/wpcontent/uploads/2012/08/Breaking_Schools_Rules_Report_Final.pdf
Are these findings limited to education and justice systems? (2010-2015) Black Hispanic White Health Education Criminal Justice CPS Economic 4th graders below proficient in reading- 2015 Children in foster care- 2013 Unemployment- 2015 Out-of-school suspensions- 2011/12 Prison population- 2013 Searches per seatbelt violation- 2011 Diabetes deaths- 2013 Children below 200% of poverty- 2013 Infant mortality rates- 2010
The mission of Race Matters for Juvenile Justice is to build a collaboration of community stakeholders who will bring their constituencies to the table and partner in the Court’s effort to reduce disproportionality and disparities. Our vision is a Charlotte-Mecklenburg Community where the composition and outcomes of juvenile courts cannot be predicted by race or ethnicity.
The RMJJ Collaborative National & Community Partners National Council of Juvenile & Family Court Judges Casey Family Programs N.C. Administrative Office of the Courts Court Improvement Project N.C. Division of Juvenile Justice Racial Equity Institute Mecklenburg County District Attorney’s Office Juvenile Court Judges of the 26th Judicial District & Office of the Family Court Administrator Mecklenburg County Department of Social Services & Youth and Family Services Charlotte-Mecklenburg Police Department Charlotte-Mecklenburg Schools Judicial District 26 Guardian ad Litem Charlotte-Mecklenburg Community Relations Committee Justice Initiatives, Inc. Council for Children’s Rights UNC Charlotte- School of Social Work UNC Chapel Hill- School of Social Work Community Building Initiative ForeSight Leadership Training Institute The Possibility Project – Charlotte Mecklenburg Ministries
Workforce Dev. & Race Analysis Current RMJJ Initiatives Public Will & Commu-nication Research, Data, & Evaluation Legislative Policy, and Economic Reform Catalyzing Change, Comm.Part & Youth Initiative Practice Change
Contacts and Protection Please cite Race Matters for Juvenile Justice – Charlotte www.rmjj.orgwhen referring to this material as the compilation is protected intellectual property. It may be used for individual education by may not be reproduced or distributed without written permission from RMJJ. Most of the informationand data are publicly available and the sources have been provided. We encourage you to learn more! For additional information, please contact: info@rmjj.org