Download
1 / 21
210 likes | 362 Vues
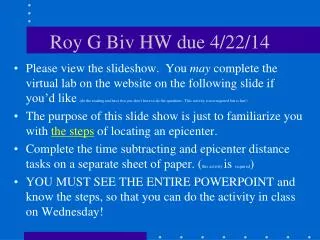
Roy G Biv HW due 4/22/14. Please view the slideshow. You may complete the virtual lab on the website on the following slide if you’d like (do the reading and have fun you don’t have to do the questions . This activity is not required but is fun!)

E N D
Roy G Biv HW due 4/22/14 • Please view the slideshow. You may complete the virtual lab on the website on the following slide if you’d like (do the reading and have fun you don’t have to do the questions. This activity is not required but is fun!) • The purpose of this slide show is just to familiarize you with the stepsof locating an epicenter. • Complete the time subtracting and epicenter distance tasks on a separate sheet of paper. (this activity is required) • YOU MUST SEE THE ENTIRE POWERPOINT and know the steps, so that you can do the activity in class on Wednesday!
Pangea Virtual LabClick the link below and complete the virtual labhttp://www.glencoe.com/sites/common_assets/science/virtual_labs/ES11/ES11.html
60s 29 m +60 S wave is always the bigger # so it always goes on top X X S Wave 30m 00s - P Wave 22m 20s • When subtracting time, be sure to borrow (if necessary) 60 seconds as shown! • Show every ridiculous step. • Try the time subtraction problems on the following slides. Did you get the accepted answer? 7m 40 s
2:33:00 2:35:30 2:35:30 – 2:33:00 = 00:02:30
2:35:10 2:39:20 2:39:20 – 2:35:10 = 00:04:10
2:32:10 2:34:00 2:34:00 – 2:32:10 = 00:01:50
How to use the P & S Wave Chart
We don’t know when the EQ started. • But we know how much time there was between the P&S wave arrivals. • Let’s say 0:04:00 • C’mon let’s say it!
We have to find a spot on the graph where P&S (careful!) are separated by 4:00.
Then drop straight down to see the distance to the epicenter. 2,600km
Now that we know the EQ was 2,600km away, when did it start? To travel 2,600km, a P-wave… needs 5:00 minutes
Back to the lab… • The difference in arrival time for Chicago is 0:02:30. • That means that Chicago is ______ km from the epicenter. 1,400
Now that we know the EQ was 1,400km away, when did it start? To travel 1,400km, a P-wave… needs 3:00 minutes
If the P-wave was detected at 2:33:00 and needed 3:00 minutes to travel it must have started at… 2:33:00 -3:00 2:30:00
If you get a nice epicenter, you do the VICTORY DANCE! The End