Download
1 / 23
270 likes | 618 Vues
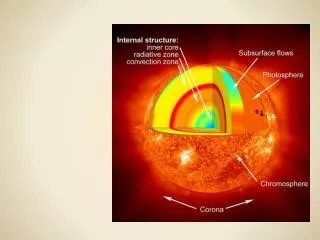
Stars. Classifying stars: H-R diagram Vogt-Russell theorem Mass-luminosity relation Evolution on the HR diagram. Classifying stars. We now have two properties of stars that we can measure: Luminosity Color/surface temperature

E N D
Stars • Classifying stars: H-R diagram • Vogt-Russell theorem • Mass-luminosity relation • Evolution on the HR diagram
Classifying stars • We now have two properties of stars that we can measure: • Luminosity • Color/surface temperature • Using these two characteristics has proved extraordinarily effective in understanding the properties of stars – the Hertzsprung-Russell (HR) diagram
HR diagram • Originally, the HR diagram was made by plotting absolute magnitude versus spectral type • But, it’s better to think of the HR diagram in terms of physical quantities: luminosity and surface temperature
If we plot lots of stars on the HR diagram, they fall into groups
These groups indicate types of stars, or stages in the evolution of stars
Luminosity of a ‘Black Body’ Radiator For the spherical object, the total power radiated = the total luminosity is: L = 4R2T4 T = temperature = Stephan-Boltzman constant = 5.6710-8 W/m2·K4 R = radius
Sizes of Stars on an HR Diagram • We can calculate R from L and T. • Main sequence stars are found in a band from the upper left to the lower right. • Giant and supergiant stars are found in the upper right corner. • Tiny white dwarf stars are found in the lower left corner of the HR diagram.
Hertzsprung-Russell (H-R) diagram • Main sequence stars • Stable stars found on a line from the upper left to the lower right. • Hotter is brighter • Cooler is dimmer • Red giant stars • Upper right hand corner (big, bright, and cool) • White dwarf stars • Lower left hand corner (small, dim, and hot)
Luminosity classes • Class Ia,b : Supergiant • Class II: Bright giant • Class III: Giant • Class IV: Sub-giant • Class V: Dwarf The Sun is a G2 V star
‘Spectroscopic Parallax’Measuring a star’s distance by inferring its absolute magnitude (M) from the HR diagram • If a star is on the main-sequence, there is a definite relationship between spectral type and absolute magnitude. Therefore, one can determine absolute magnitude by observing the spectral type M. • Observe the apparent magnitude m. • With m and M, calculate distance Take spectrum of star, find it is F2V, absolute magnitude is then M = +4.0. Observe star brightness, find apparent magnitude m = 9.5. Calculate distance:
“Vogt-Russell” theorem for spheres of water • Spheres of water have several properties: mass, volume, radius, surface area … • We can make a “Vogt-Russell” theorem for balls of water that says that all of the other properties of a ball of water are determined by just the mass and even write down equations, i.e. volume = mass/(density of water). • The basic idea is that there is only one way to make a sphere of water with a given mass.
“Vogt-Russell” theorem • The idea of the “Vogt-Russell” theorem for stars is that there is only one way to make a star with a given mass and chemical composition – if we start with a just formed protostar of a given mass and chemical composition, we can calculate how that star will evolve over its entire life. • This is extremely useful because it greatly simplifies the study of stars and is the basic reason why the HR diagram is useful.
Mass - Luminosity relation for main-sequence stars Mass in units of Sun’s mass
Mass-Lifetime relation • The lifetime of a star (on the main sequence) is longer if more fuel is available and shorter if that fuel is burned more rapidly • The available fuel is (roughly) proportional to the mass of the star • From the previous, we known that luminosity is much higher for higher masses • We conclude that higher mass star live shorter lives
A ten solar mass star has about ten times the sun's supply of nuclear energy. Its luminosity is 3000 times that of the sun. How does the lifetime of the star compare with that of the sun? • 10 times as long • the same • 1/300 as long • 1/3000 as long
Evolution of stars • We have been focusing on the properties of stars on the main sequence, but the chemical composition of stars change with time as the star burns hydrogen into helium. • This causes the other properties to change with time and we can track these changes via motion of the star in the HR diagram.
The Height-Weight diagram was for one person who we followed over their entire life. • How could we study the height-weight evolution of people if we had to acquire all of the data from people living right now (no questions about the past)? • We could fill in a single HW diagram using lots of different people. We should see a similar path. • We can also estimate how long people spend on particular parts of the path by how many people we find on each part of the path.
Questions • Is the main sequence lifetime of a massive star longer or shorter than that of a less massive star? • Which is cooler, a star with spectral type G2 or a star with spectral type A6? • An F5 star has an apparent magnitude of 7. How far away is it?