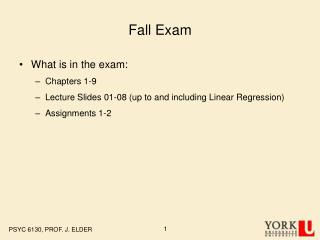
Fall Exam
Prepare for your PSYC 6130 exam with this comprehensive review covering essential topics from Chapters 1-9. This resource includes lecture slides up to Linear Regression, key concepts of descriptive and inferential statistics, hypothesis testing, types of variables, scales of measurement, as well as correlation and regression analysis. Familiarize yourself with important formulas, the Central Limit Theorem, effect sizes, and confidence intervals. Understanding these concepts will help you excel in your examination and deepen your grasp of statistics in psychology.

Fall Exam
E N D
Presentation Transcript
Fall Exam • What is in the exam: • Chapters 1-9 • Lecture Slides 01-08 (up to and including Linear Regression) • Assignments 1-2 PSYC 6130, PROF. J. ELDER
Basics Scales of measurement Continuous vs. discrete variables Independent and dependent variables Experimental vs. correlational research Populations vs. samples Summation notation Tables and Graphs f, cf, rf, crf, cpf Grouped frequency distributions Apparent vs real limits Percentiles, percentile ranks, linear interpolation Central Tendency and Variability Means, medians, modes Standard deviations, SQI, range Skewness, kurtosis The Normal Distribution Probability rules Z scores SEM Central Limit Theorem Descriptive Statistics PSYC 6130, PROF. J. ELDER
Inferential Statistics: Hypothesis Tests of the Mean • Introduction to NHT • Type I and Type II errors • One-tailed vs two-tailed tests • 6-step procedure • One-sample z test • One-sample t test • t Test for two independent sample means • Homogeneity of variance • The Matched t Test • Going beyond null hypothesis testing • Planning experiments (power) • Effect size • Confidence intervals PSYC 6130, PROF. J. ELDER
Correlation and Regression • Pearson’s r • Significance and power for Pearson’s r • Fisher Transform • Regression formulae • Explained and unexplained variance • Coefficients of determination, non-determination • Homoscedasticity • Confidence intervals for predictions • Partialing out PSYC 6130, PROF. J. ELDER
Basic Procedure for Statistical Inference • State the hypothesis • Select the statistical test and significance level • Select the sample and collect the data • Find the region of rejection • Calculate the test statistic • Make the statistical decision PSYC 6130, PROF. J. ELDER
NHT for Two Small Independent Samples PSYC 6130, PROF. J. ELDER
Pooled Variance PSYC 6130, PROF. J. ELDER
Summary: t-Tests for 2 Independent Sample Means PSYC 6130, PROF. J. ELDER
Separate Variances t Test • If • Population variances are different (suggested by substantially different sample variances) AND • Samples are small AND • Sample sizes are substantially different • Then • Pooled variance t statistic will not be correct. • In this case, use separate variances t test PSYC 6130, PROF. J. ELDER
Separate Variances t Test • This t statistic is well approximated by a t distribution. • Unfortunately, calculating the appropriate df is difficult. • SPSS will calculate the Welch-Satterthwaite approximation for df as part of a 2-sample t test: PSYC 6130, PROF. J. ELDER
More on Homogeneity of Variance • How do we decide if two sample variances are different enough to suggest different population variances? • Need NHT for homogeneity of variance. • F-test • Straightforward • Sensitive to deviations from normality • Levene’s test • More robust to deviations from normality • Computed by SPSS PSYC 6130, PROF. J. ELDER
Levene’s Test: Basic Idea • SPSS reports an F-statistic for Levene’s test • Allows the homogeneity of variance for two or more variables to be tested. • We will cover the F distribution in the winter term. PSYC 6130, PROF. J. ELDER
Independent or Matched? • Application of the Independent-Groups t test depended on independence both within and between groups. • There are many cases where it is wise, convenient or necessary to use a matched design, in which there is a 1:1 correspondence between scores in the two samples. • In this case, you cannot assume independence between samples! • Examples: • Repeated-subject designs (same subjects in both samples). • Matched-pairs designs (attempt to match possibly important attributes of subjects in two samples) PSYC 6130, PROF. J. ELDER
Better alternative: The matched t-test using the direct difference method PSYC 6130, PROF. J. ELDER
Limitations of NHT • Criticisms of NHT date from the 1930s. • Null hypothesis is rarely true. • The real question is not about the existence of an effect, but about the nature of the effect: • What is the direction of the effect? • What is the size of the effect? • How important is it? • What are the underlying mechanisms (theory)? PSYC 6130, PROF. J. ELDER
Magnitude of Effect • A problem with a point estimate is that it suggests a certainty we do not really have. • A more complete and useful description of the magnitude of the effect is provided by a confidence interval. PSYC 6130, PROF. J. ELDER
Importance of Effect • However it is often more meaningful to compare the treatment effect to the overall variation in the measured variable: PSYC 6130, PROF. J. ELDER
Example Effect Sizes Group 1 Group 2 PSYC 6130, PROF. J. ELDER
Planning a Study • There are many considerations that go into planning an experiment or study. • Here we focus on the statistical considerations. • Some possible questions: • How many samples (e.g., subjects) will I need for my study? • I already know that I will only have access to n samples (subjects). Will this be enough? • Answering these questions depends on understanding the relationship between sample size, effect size, and statistical power. PSYC 6130, PROF. J. ELDER
NHD AHD Standardized Distributions of the Difference of the Means 0.4 0.3 0.2 Probability p(t) 0.1 0 -4 -2 2 4 6 8 0 t PSYC 6130, PROF. J. ELDER
Pr(t) Pr(t) Expected t value Estimating Power (Non-central t distribution) (Central t distribution) PSYC 6130, PROF. J. ELDER
- + - + + Calculating Power from Sample Size and Effect Size PSYC 6130, PROF. J. ELDER
Planning Experiments • Planning experiments may involve estimating any one of these variables given knowledge or assumptions about the other two: PSYC 6130, PROF. J. ELDER
Standard Definition of Correlation (Sample) PSYC 6130, PROF. J. ELDER
covariance unbiased covariance Computational Formula For a population: For a sample: PSYC 6130, PROF. J. ELDER