Download
1 / 30
1.05k likes | 3.98k Vues
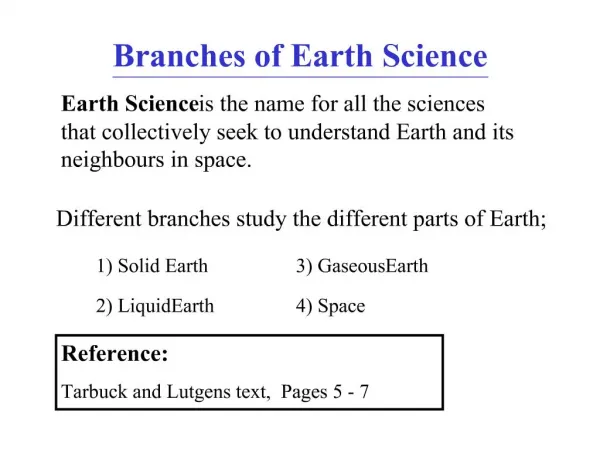
Branches of Science. Figure 3. Interest Grabber. Section 1.2. Design Your Own Experiment Suppose that you want to conduct a test to see which brand of cleanser produces the best results when cleaning a kitchen floor. Think about how you would conduct this test.

E N D
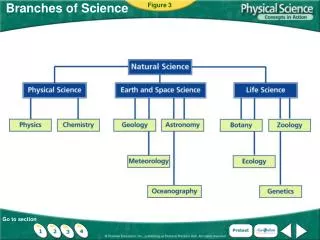
Branches of Science Figure 3
Interest Grabber Section 1.2 Design Your Own Experiment Suppose that you want to conduct a test to see which brand of cleanser produces the best results when cleaning a kitchen floor. Think about how you would conduct this test. 1. What materials would you need? 2. What procedure would you follow? 3. How would you determine which cleanser produces the best results?
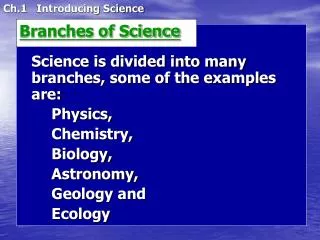
Scientific method Is the way that scientists gather information & test ideas. It is a logical plan for solving a puzzle. Has 4 key steps: 1.making observations 2. forming a hypothesis 3. doing experiments 4. drawing a conclusion A.
Observation: examination of something in nature Hypothesis: a possible answer to a question Experiment: a controlled procedure designed to test a hypothesis. Usually has 2 parts: control or control group: has no variable experimental group: this group has the variable = the factor that can change in an experiment
When the experiment is completed the experimental group is compared to the control group. It is then decided how the variable has affected the experiment. • The results of an experiment are called data. • 2 types: • Qualitative- descriptive data • Quantitative- numerical data
At the end of an experiment, a conclusion is drawn from the data. A conclusion = a statement that tells us if the data supports the hypothesis. Theory = hypothesis that has been tested & supported many times. A theory is the basis for more experiments. Can be changed as new info is gained. Scientific Law =general statement that describes some pattern in nature.
A Scientific Method Figure 7
A Scientific Method Figure 7
A Scientific Method Figure 7
A Scientific Method Figure 7
A Scientific Method Figure 7
A Scientific Method Figure 7
Interest Grabber Section 1.3 Measuring Length by the Handful The English units that we use in the United States developed over a long period of time. For example, the hand was devised in ancient times as a unit of length. It was defined as the length of a person’s hand from the little finger to the thumb. Today the height of horses is still measured in hands, but the definition of a hand is standardized at 4 inches or 10.16 centimeters.
SI Base Units Figure 13
Quantity- something that has magnitude, size, or amount. May not be the same as a measurement. • SI Measurement: • Adopted in 1960 • Standards of SI Are objects or natural phenomena that are of constant value, easy to preserve & reproduce, & practical in size.
Base units: Mass- SI unit- kilogram. Weight- measure of the gravitational pull on matter Length- SI unit – meter Derived SI units- are combinations of quantities
Measurement Unit Symbol length meter m volume liter L mass kilogram kg force newton N temperature degree Celsius C time second s Units of Measurement
SI Units: 1.based on multiples of 10 2.each unit can be multiplied or divided by 10 3.prefixes are used to show how many times the base is multiplied or divided 4.prefix is added to the name of the base unit 5.symbol for prefix is written before the symbol of the base unit
Prefix Symbol Meaning tera- T 1, 000,000,000,000 or 1012 giga- G 1,000,000,000 or 109 mega- M 1,000,000 or 106 kilo- k 1000 or 103 hecto- h 100 or 102 deka- da 10 or 101 deci- d 1/10 or 10-1 centi- c 1/100 or 10-2 milli- m 1/1000 or 10-3 micro- 1/1,000,000 or 10-6 nano- n 1/1,000,000,000 or 10-9 pico- p 1/1,000,000,000,000 or 10-12 femto- f 1/1,000,000,000,000,000 or 10-15 atto- a 1/1,000,000,000,000,000,000 or 10-18 Metric Prefixes
Density- the ratio of mass to volume = mass/volume: D = m/v. SI unit = kg/cm3 Density also expressed as: g/mL & g/L & g/cm3 • Conversion Factor- a ratio derived from the equality between 2 different units that can be used to convert from 1 unit to the other.
Using Scientific Notation Section 1.3
Using Scientific Notation Section 1.3
Using Scientific Notation Section 1.3
Using Scientific Measurements • Accuracy- refers to the closeness of measurements to the correct or accepted value of the quantity measured. So measured values that are accurate are close to the accepted value. • Precision- refers to the closeness of a set of measurements of the same quantity made in the same way. So measured values that are precise are close to one another but not necessarily close to the accepted value.
Percent error- is calculated by subtracting the experimental value from the accepted value, dividing the difference by the accepted value, & then multiplying by 100: • Percent error = Valueaccepted__-__Valueexperimental X 100 • Valueaccepted • Error in Measurement: • The skill of the measurer & the tool being used to measure will affect the accuracy of results.
Significant Figures in a measurement consist of all the digits known with certainty plus one final digit, which is somewhat uncertain or is estimated. • Scientific Notation: • Numbers are written in the form M X 10n where the factor M is a number greater than or equal to 1, but less than 10 & n is a whole number. • Numbers written in scientific notation only show the significant figures.
Interest Grabber Section 1.4 Creating and Interpreting Graphs Many people have pets. One survey of pet owners showed the following breakdown of the type of pets owned: 35% dogs; 35% cats; 10% birds; 5% hamsters, gerbils, mice, rats; 5% reptiles; and 10% other.
Reading Strategy Section 1.4 Previewing a. Variable y is plotted vs. variable x. b. Showing how a variable responds to changes in another c. Scaled bars used to represent d. Comparing a similar set various measurements of data e. A divided circle, with each “slice” f. Showing how a part relates to representing a proportional fraction the whole
Mass vs. Volume of Water Figure 21
Interest GrabberAnswers Section 1.2 1. What materials would you need? Sample answers may include two or more brands of cleansers, sponge or rag, stopwatch, and different materials to produce stains. 2. What procedure would you follow? Sample procedures might test the effect of various cleansers on one type of stain, or on several types of stains. Students might try to control certain variables in the experiments, such as the amount of cleanser used or the time spent scrubbing. 3. How would you determine which cleanser produces the best results? The quality of each cleanser could be described in terms of how fast it cleans, how many types of stains it cleans, or how much is needed to clean a stain.