Linkage Disequilibrium
Linkage Disequilibrium. Granovsky Ilana and Berliner Yaniv. Computational Genetics 19.06.03. What is Linkage Disequilibrium?.


Linkage Disequilibrium
E N D
Presentation Transcript
Linkage Disequilibrium Granovsky Ilana and Berliner Yaniv Computational Genetics 19.06.03
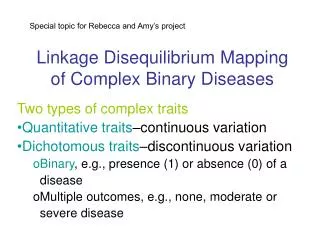
What is Linkage Disequilibrium? • When the occurrence of pairs of specific alleles at different loci on the same haplotype is not independent, the deviation form independence is termed linkage disequilibrium • In general, linkage disequilibrium is usually seen as an association between one specific allele at one locus and another specific allele at a second locus
LinkageDisequilibrium Coefficient Definitions • Xi-number of observations in cell i (X1+X2+X3+X4)=n • D11-coefficient of gametic linkage disequilibrium • between allele 1 at locus 1 and allele 1 at locus 2 • D11=E[X1X4-X2X3|n=1]
Population-based sampling and the EH program • We wish to test the absence of disequilibrium between allele A at locus 1 and allele B at locus 2 (DAB=0) • The sample of individuals we have consist of genotyping data with no possibility to fully distinguish all of the haplotypes in each individual
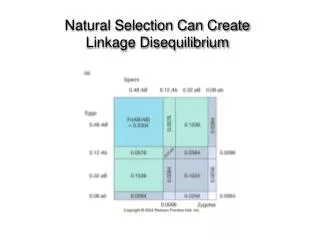
Table of all possible two-locus genotypes In cell 5 there can be either of two phases, AB/ab or Ab/aB
Analysis of likelihood • We maximize the log likelihood of the data observed: • For cell 1: p1=[P(A B)] • For cell 4: p4=2P(A B)P(A b) • For cell 5: p5=P(A B/a b)+P(A b/a B) = =2P(A B)P(a b)+2P(A b)P(a B) 2 2
Analysis of likelihood • We maximize the likelihood above over the possible haplotype frequencies (p(A), p(B) and DAB. • This likelihood is then compared with the maximum likelihood when DAB is set equal to 0 (absence of linkage disequilibrium)
Example *When censoring k5 all the haplotypes can be uniquely determined
Example cont. • P(A) = 0.28+0.24 = 0.525 • P(B) = 0.28+0.18 = 0.468 • DAB = p(A B) –p(A)p(B) = 0.28 – 0.525*0.468 = 0.0387 * Biased example due to the elimination of the 50 observations in k5.
EH program input file format • EH = estimated haplotype. • Input file EH.dat Line 1: Number of alleles at each of the two loci Line 2: k1 k4 k7 Line 3: k2 k5 k8 Line 4: k3 k6 k9
EH program output file • Output – Estimates of Gene Frequencies (including k5) # of typed Individuals: 129
Chi square test • The difference between the 2 chi-square is 8.89 • The P-value associated with chi-square • (with 1 df) is 0.002873 • It is clear the k5 contributes siginificant • information
Multiallelic genotype information in EH program Line 1: Number of alleles at each locus Subsequent lines:
Full dataSolution file: Censored data solution file. Ex. 23 Censored data 1/1 haplotype data