Modelling in the transport planning process
Modelling in the transport planning process. SUMP Technical Training Workshop Cologne, Germany 21-22 November 2011. Summary. Training session on modelling An introduction to transport demand analisys Transport models: what are and how can be used to develop scenarios How to build a model

Modelling in the transport planning process
E N D
Presentation Transcript
Modelling in the transport planning process SUMP Technical Training Workshop Cologne, Germany 21-22 November 2011
Summary • Training session on modelling • An introduction to transport demand analisys • Transport models: what are and how can be used to develop scenarios • How to build a model • Four steps models • Land use and transport models • Microsimulation models • Q&A
Introduction Transportdemandanalisys
Transport demand analysis • We need to analyse the interactions between transport demand and supply of the mobility system when we want to plan one or more interventions (policy measures, infrastructure, etc.) • Transport demand analysis aims at investigating and quantifying the relationship among the fundamental explicative variables of TD: e.g. demographic characteristics, income, land use, car ownership and the characteristics of the transport supply
Transport demand analysis • Elementsthataffecttransportdemand and theirinteractions Car ownership Lifestyles / Cultural aspects Land use Production system / Economy Transport supply
Chapter 1 Transportmodels: What are and how can beused
What is a transport model? • We can refer to a “model” for indicating • The theoretical relationship among variables (e.g. the gravitational model) • The software package that is based on some relationships or that allows for their definition or for a tailored application (e.g. CUBE, VISUM, MEPLAN) • The software application itself (the transport model of the city of Cologne) • A family of applications of the same type (e.g. four stages models, microsimulation models, etc.)
For what TMs can be used? • Very different purposes • to predict the transport demand for a new infrastructure in the planning process • to predict the transport demand served by a new public transport line • to compare the impacts of different road layouts • to estimate the impact of a new road toll • to exactly locate bottlenecks and congestion situations on the network • to estimate the impacts of accessibility variations on the territorial system
For what TMs can be used? • Transport models represents the interaction between transport demand and supply • They are used always to anticipate something before it happens: i.e. they must have predictive capabilities • Models are useful especially when we need to find answers to complex problems that can not be solved with simple instruments • Complexity may result from the “huge amount of information” we need to process (too long process without a model)… or from the so called “network effects” (how endogenous variables interacts among them)
TMs: a functional classification • We can classify TMs according to their operational capabilities: • Strategic (policy) models (not network based): transport supply is not spatially defined • Uni-modal models: demand (exogenous) and only one transport mode is considered (e.g. private transport) • Multi-modal models: demand (exogenous) and several transport modes are considered (but no interactions among them) • Four steps models: demand (endogenous) and supply represented by several transport modes in competition • Land-use and transport models: feedback between the transportation system and location choices is taken into account • Microsimulation models: only one mode is taken into account and its demand is analysed at individual level
TMs: How to chose? • When we look to the most appropriate model for our purposes we need to evaluate several aspects: • Problem to be solved: for what I really need the model? • Decisional context: at which level (strategic, operational)? • Level of accuracy: what are the expectations about the level of (spatial, analytical) detail of the model results? • State-of-the-Art of models: what are the potentials and characteristics of available models? • Data availability: how many quantitative information are available for building the model? • Availability of resources: financial, time and human resources as well as the level of competence of HRs
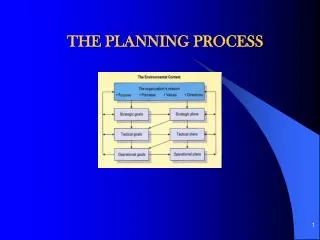
Chapter 2 How to build a transportmodel
Building a TM: key steps • Model design • Data collection and processing • Model implementation • Model calibration • Model validation • Use of the model for predictive purposes
Building a TM: design • The design phase concerns the definition of the model components: • Study Area: define the model’s geographical boundaries (e.g. administrative or infrastructural boundaries) • Zoning: how many zones and their characteristics (e.g. administrative zones, traffic attraction/generation, coherence with the network) • Transport network: which are the infrastructures to be represented? (coherently with the zoning process)
Building a TM: design • Demand segments: which segments and how many? (e.g. trip purposes, income, distance) • Transport modes: which modes and how many (only if the model is multi-modal and flexible) • Period of simulation (e.g. peak hour, peak interval, all the day) • Period of prediction: for which future year or years we want the model to simulate scenarios?
Building a TM: data collection • Data collection and data processing are crucial steps • We need to collect different types of data: • Exogenous inputs (e.g. geometrical-functional characteristics of the network) • Functional parameters (e.g. operative costs) • Behavioral parameters • Comparison data for calibration (e.g. traffic counts) • Comparison data for validation(e.g. further traffic counts) • Data for building scenarios (e.g. new residential developments)
Building a TM: data collection • Very often the needed data is not available in the format requested by the model • And we may need a lot of efforts for producing the requested data • For some data we may also need to conduct surveys (e.g. Stated Preferences) or to carry out complex procedures (e.g. OD matrix estimation from traffic counts)
Building a TM: implementation • Model implementation consists in: • Translate in the software “language” our model structure • “Populate” the model with exogenous data and parameters • Test the model against missing information and errors • Difficulties in implementation are strictly liked to the used software. • Networks implementation is often the most complex phase, unless we already have the data in the requested format. • The public transport network (with information on timetables, frequencies, etc.) needs a special attention and time resources for its elaboration.
Building a TM: calibration • Ways of calibrating models: • Trial and error: we define the value of parameters, run the model and compare the model results with some observed data; then we correct the parameters and run the model again • Optimisation: it’s an iterative “trial and error” process based on a huge number of simulations and functions to be maximised or minimised • Likelihood function: algorithm parameters are not known and we calculate their value by using observed data • The trial and error process is the only one that can be always applied
Building a TM: validation • By validating the model we verify the assumption of having constant calibration parameters to be acceptable • If our calibration parameters are really stable and representatives, the model should be able to predict also observed data different from those used in calibration (e.g. a different set of traffic counts) • The validation process has its main obstacle in the lack of data • Producing two set of data (one for calibration and one for validation) can be expensive • So called “observed data” is often actually estimated data • That’s why the validation process is often not carried out or documented
Building a TM: prediction • The predictive phase consists in running the model for developing scenarios • A scenario is a set of quantitative hypothesis related to parameters and exogenous variables in the model • To simulate scenarios we need to implement the model with two different types of input data: • Expected changes produced by variables that are independent from our policy simulation (e.g. Population growth or rise of fuel costs) • Changes caused by the policy simulation (e.g. a new tram line or new tariffs for public transport) • We need to simulate different scenarios in order to understand the changes produced by the two types of input
Building a TM: prediction • Reference scenario: it simulates the effects of changes that are independent from the policies we want to implement (e.g. only the population changes) • Business as usual (BAU) scenario: changes independent from policies plus the effects of selected policies already planned and interventions which come at a late stage in the decision-making process (e.g. extension of a tram line and suppression of some bus lines) • Policy scenarios: these predict the effects of policies that we want to simulate (e.g. a new tram line) • The BAU scenario is used to compare the effects of new policies with those produced by the current strategy
Building a TM: prediction • Those scenarios related to one single intervention predict the effects of that specific measure • In some cases a single intervention may have a very limited effect on the transport system and therefore a model simulation is not convenient • Simulating the effect of single measures separately can be a very time consuming process (with a big impact on the budget!) • That’s why TMs are used to simulate the effects of “package of measures” especially designed (by mobility planners) to produce some positive effects on the transport system
Building a TM: prediction • We can classify those “package of measures” by • Type: e.g. infrastructural interventions on the private road network, infrastructural intervention of the public network, measures related to PT tariffs, etc. • Objective: e.g. package of measures that allows for a new modal split more in favour of the public transport mode; interventions for lowering congestion from a given area, etc. • Budget: e.g. Investments and pricing options • For some measures we may have no parameters in the model • Sometimes we can define exogenously the effect of such measures, but very often qualitative measures are not predicted by the models
Chapter 3 Fourstepsmodels
Four step models • The four basic phases (models) Howmanytripsoriginatesfrom a single zone? TRIP GENERATION What are the destinationsofthesetrips? TRIP DISTRIBUTION Whichtransportmodes are used? MODE USAGE Whattrafficflows and PT rides are generated? TRIP ASSIGMENT
Four step models • Trip generation (green totals) • Volume of trips attracted and generated from a single zone; it is functionally linked to the type and intensity of land use and, as a consequence, to some specific characteristics like demography and socio-economic conditions of the residents, presence of workplaces, shops, services, etc. • Trip distribution (red cells) • The total volume of trips is organised in a O/D matrix
Four step models • Mode usage / mode choice • The estimated volume of trips is further attributed to the available transport modes (modal split surveys are often used to calibrate the model) • Trip assignment /route choice • The estimated volume of trips is spatially represented (i.e. single O/D trips are attributed to the network by choosing among all available routes from O to D) • Output: amount of traffic per single link, route minimisation, trip time and cost per single O/D • Random utility models (like the Logit) replicates the behaviour of a rational user who maximises its utility function
Four step models • Feedbacks Travel times depends on traffic volumes (i.e. number of car trips estimated by the mode usage model) And Mode choice depends on travel times (estimated by the trip assignment model) TRIP GENERATION TRIP DISTRIBUTION MODE USAGE TRIP ASSIGMENT
Four step models • Feedbacks Travel times depends on traffic volumes: i.e. number of car trips estimated by the mode usage model starting from the OD totals estimated by the trip distribution model And Trip distribution depends on impedance, that include travel times estimated by the trip assignment model TRIP GENERATION TRIP DISTRIBUTION MODE USAGE TRIP ASSIGMENT
Chapter 4 Landuse and transportmodels
Land-use and transport models • There is a strong relationship between land use and transport: travel demand is a derived one (I need to move from A to B because I need to do something – with the exception of a sightseeing tour or moving just for the pleasure of moving) • Classic transport models do not take into consideration the impacts of the transport system on land development and land use • Classic models are not able to investigate some phenomena like for example urban sprawl • Choices related to location and transport are inter-related: The 'land-use transport feedback cycle‘ (see next slide)
Land-use and transport models • The distribution of land uses, such as residential, industrial or commercial, over the urban area determines the locations of human activities such as living, working, shopping, education or leisure • The distribution of human activities in space requires spatial interactions or trips in the transport system to overcome the distance between the locations of activities • The distribution of infrastructure in the transport system creates opportunities for spatial interactions and can be measured as accessibility • The distribution of accessibility in space co-determines location decisions and so results in changes of the land use system.
Land-use and transport models • Land use impacts on transport • Residential density (compact city) > together with a mixed use of land areas it favours public transport and reduces trip distances • Workplace concentration > good for PT but longer distances • Neighbourhood planning > street design may encourage walking and cycling; shops and leisure activities may generate trips • Transport impacts on land use • Improved accessibility > increase of land revenues, sprawling, attraction of new business activities • Higher transport costs > shorter distances and reduction of trip frequency
Land-use and transport models • T&T models should represent • the location of families, business activities (producers) and the transport supply • transport supply in a way it can simulate changes in its configuration • rules for simulating location choices of families and producers after a variation in transport conditions
Chapert 5 MICROSIMULATION MODELS
Microsimulation models • Traditional trip assignment models estimate total traffic flows and veh/speeds are average values in the time interval (e.g. peak hour) • Vehicles are an undifferentiated fleet running at a constant speed and distancing (it’s a static approach) • In this way we ca not properly analyse: • Distribution of the vehicle flow in a time interval (the use of the network is not constant) • Internal distribution of the vehicle flow (different speeds) • For example we can not simulate the evolution of vehicle queues in a congested network
Microsimulation models • Microsimulation models analyse and elaborate instant by instant the movement of every single vehicle on the network by taking into account • the position of the vehicle on the network • the behavior induced by vehicle’s characteristics and driver attitudes • the infrastructure’s geometric layout, traffic control systems and level of congestion • They are mostly used for predicting traffic flows at crossroads, motorway junctions, roundabouts, parking areas, toll gates, etc. • MS models use a variety of complex algorithm (route choice, car-following, lane-changing and gap-acceptance, on-ramp/off-ramp, look-ahead)
Microsimulation models • Quantitative outputs: veh flows, instant and avg speed, travel time, delta between actual and optimal travel time, number of stops, queue time, length of queue, statistics on air pollution levels and fuel consumption, etc. • Graphic outputs: bi/tri-dimensional animations
Levelofcongestion in a microsimulationmodel Microsimulation models
Microsimulation models: some examples • City of Lecco (48.000 inh – Lombardy Region, Italy) • Urban Mobility and Traffic Plan (PUMT) plus Urban Parking Programme (PUP) • Key measures for the city centre: new traffic rules, bus lanes, new distribution of parking spaces
Microsimulation models: some examples • Model application: estimation of traffic and environmetal impacts (fuel consumption, emissions) » Movie
Microsimulation models: some examples • Masterplan for the new development of Cornaredo in Lugano (CH) • The Project: the opening of a new gallery for connecting the local road network with the ringroad and the motorway gives the opputunity to redisign the district of Cornaredo… from a peripheral area to a new gate to Lugano
Microsimulation models: some examples • Model application: road network design and optimisation process (road sizing and nodes configuration) » Movie 1 » Movie 2
Thanks for your attention Training materials edited by Davide Fiorello, Simone Bosetti, Cosimo Chiffi TRT Trasporti e Territorio Srl, Milan (Italy) For more information write to bosetti@trt.it