Download
1 / 21
210 likes | 418 Vues
Incorporating Statistical Process Control and Statistical Quality Control Techniques into a Quality Assurance Program. Robyn Sirkis U.S. Census Bureau. Purpose. Incorporate SPC and SQC methods into quality assurance program

E N D
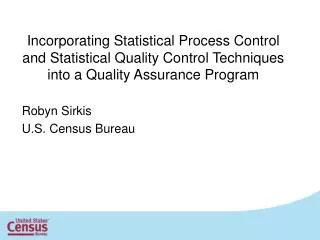
Incorporating Statistical Process Control and Statistical Quality Control Techniques into a Quality Assurance Program Robyn Sirkis U.S. Census Bureau
Purpose • Incorporate SPC and SQC methods into quality assurance program • Monitor and improve interviewer performance to ensure the collection of high quality data in real time • Examine different types of quality indicators
Outline • Background • Cluster Analysis • Statistical Process Control (SPC) and Statistical Quality Control (SQC) Methodology • SPC and SQC Examples • Next Steps • Conclusion
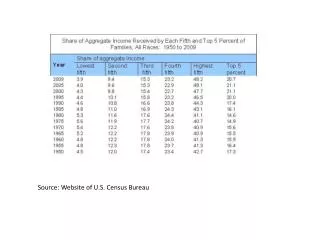
Data for Analysis • National Health Interview Survey 2008 to 2010 data • Quality indicators: include item don’t know and refusals responses • Item nonresponse rates for the current asthma estimate, family income question, and pneumonia shot question • Quality indicators: exclude don’t know, refusals and missing responses • Current asthma estimate: proportion of “no” responses • Family income question: average and standard deviation • Pneumonia shot question: proportion of “yes” responses
Cluster Analysis • Compare interviewers working in similar census tracts with similar workloads • Choose clustering variables (variable reduction) • Census 2000 Planning Database • Nine variables chosen • Create clusters within Regional Office (RO) • Group census tracts into clusters • 4 to 8 clusters within each RO
SPC and SQC Terminology • Statistical Process Control (SPC) • Graphical tool to measure and analyze variation in a process over time • Control charts: use control limits and time component • Multivariate charts: reduces amount of charts for correlated measures • Statistical Quality Control (SQC) • Broad array of statistical tools to measure and improve operational procedures • Analysis of Means (ANOM) charts: use decision limits • ANOM charts: interviewer is an example of a rational subgroup 6
SPC and SQC Methodology • Construct cluster-level control chart including historical months data • Historical months: January 2008 to November 2010 • Construct the trial control limits by removing observations outside the limits • Construct final cluster-level control chart including historical and current months data • Current month: December 2010
SPC and SQC Methodology Continued • Construct Analysis of Means (ANOM) charts for the current month (December 2010) • Construct interviewer-level control charts if overall average or proportion outside decision limits in ANOM chart
Family Income Example • Average and standard deviation of family income • Family income item nonresponse rate • SPC and SQC techniques used to improve interviewer performance in real time • Current month: December 2010
Analysis of Means Chart December 2010 (RO = 1, Cluster = 4) =.1 Limits: UDL Mean LDL 1 2 3 4 5 6 7 8 9 10 11 Interviewer Group Sizes: Max n = 10 Min n = 2 10
Process Not in Control (RO = 1, Cluster = 4, Interviewer = 3) UCL 1 1 3 Limits: LCL Average UCL Standard Deviation S S D M A S D M A J S D e e a p e e a p u e e p c r r p c r r n p c LCL 2 2 2 2 2 2 2 2 2 2 2 0 0 0 0 0 0 0 0 0 0 0 0 0 0 0 0 0 0 0 1 1 1 1 1 M A 8 8 8 9 9 9 9 0 0 0 0 0 a p Month r r Subgroup Sizes: Min n = 2 Max n = 10 2 2 0 0 8 11
Current Asthma Estimate Example • Current asthma estimate uses responses from three questions • Proportion of “no” responses for current asthma estimate • Current asthma estimate item nonresponse rate
Analysis of Means Chart December 2010 (RO = 2, Cluster = 3) =.1 Limits: 1.0 UDL =.88 0.8 Rate LDL 0.6 0.4 0.2 1 2 3 4 5 6 7 8 9 10 11 12 13 14 Interviewer Group Sizes: Min n = 2 Max n = 13 13
Process Not in Control (RO = 2, Cluster = 3, Interviewer = 13) 3 Limits: UCL 1.0 =.89 0.8 Rate 0.6 LCL 1 0.4 0.2 F M A M J J A S N D M A M J J A S O D M A M J J A S O N D e a p a u u u e o e a p a u u u e c e a p a u u u e c o e b r r y n l g p v c r r y n l g p t c r r y n l g p t v c 2 2 2 2 2 2 2 2 2 2 2 2 2 2 2 2 2 2 2 2 2 2 2 2 2 2 2 2 2 0 0 0 0 0 0 0 0 0 0 0 0 0 0 0 0 0 0 0 0 0 0 0 0 0 0 0 0 0 0 0 0 0 0 0 0 0 0 0 0 0 0 0 0 0 0 0 0 1 1 1 1 1 1 1 1 1 1 8 8 8 8 8 8 8 8 8 8 9 9 9 9 9 9 9 9 9 0 0 0 0 0 0 0 0 0 0 Month Subgroup Sizes: Min n = 2 Max n = 24 14
Summary of Charts • Current Asthma Estimate • Process not in control in interviewer-level control chart • Family Income • Average and standard deviation exceed the control limits in interviewer-level control chart • Interviewers did not have item nonresponse rates significantly different from RO and cluster for December 2010
Implementation of SPC and SQC Techniques • Choose quality indicators • Multivariate charts minimize the number of charts to monitor by combining correlated measures • Select interviewers to follow-up • Most quality indicators where process is not in control • Highest difference between control limits and quality indicator for current month 16
Next Steps • Incorporate SPC and SQC techniques into current quality assurance program • Current quality assurance program: conduct second interview to determine if interviewers conducting interview in accordance with established procedures • Current sampling method: random and supplemental • Stratified random sampling • Supplemental sampling: additional cases and interviewers identified by Headquarters and the Regional Office 17
Next Steps Continued • Add targeted sampling method • Target interview cases which bear hallmarks of suspected falsification • Choose quality indicators to select cases for targeted sampling method • Use statistical models to choose indicators which predict potential data quality issues • Includes using digit frequency and length of field techniques • Includes indicators from PANDA system such as interview times and contact attempts 18
Next Steps Continued • Choose methods for targeted sampling method • SPC and SQC techniques • Statistical tests such as chi-square test to compare distributions • Unlikely response pattern analysis • Use weighting equations to leverage best available methods and measures to optimize detection of potential data quality issues • Select additional interviewers just using SPC and SQC techniques and then other interviewers using different methods 19
Conclusion • Crucial to monitor both item nonresponse rates and other quality indicators • Develop method to identify interviewers whose work should be investigated given the available amount of resources for follow-up purposes 20
Contact Information robyn.b.sirkis@census.gov