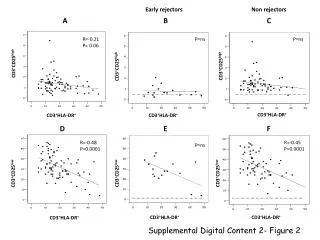
Correlation of CD3+ CD25 High and Low Ratios in Pre-Transplant Patients
This study investigates the correlation among pre-transplant CD3+CD25high/CD3+HLA-DR+ and CD3+CD25low/CD3+HLA-DR+ ratios measured in blood samples from patients. Using FACS analysis, we examined triple-labelled samples with anti-CD25, anti-HLA-DR, and anti-CD3 markers. Results show distinct patterns in rejecting versus non-rejecting patient groups, highlighting significant correlations (R values) between the analyzed parameters. The implications of these correlations on transplant outcomes are discussed, with additional details provided in supplemental digital content.

Correlation of CD3+ CD25 High and Low Ratios in Pre-Transplant Patients
E N D
Presentation Transcript
6 P=ns P=ns 5 4 3 2 1 0 0 10 20 30 40 50 Early rejectors Non rejectors A B C R=-0.21 P= 0.06 P=ns CD3+CD25high CD3+CD25high CD3+CD25high CD3+HLA-DR+ CD3+HLA-DR+ CD3+HLA-DR+ D E F 60 R=-0.48 P=0.0001 R=-0.45 P=0.0001 R=-0.53 P=0.019 P=ns 50 40 CD3+CD25low CD3+CD25low CD3+CD25low 30 20 10 0 0 10 20 30 40 50 CD3+HLA-DR+ CD3+HLA-DR+ CD3+HLA-DR+ Supplemental Digital Content 2- Figure 2
Correlation among pre-transplant CD3+CD25high/CD3+HLA-DR+ and CD3+CD25low/CD3+HLA-DR+ ratios. Pre-transplant blood samples were triple-labelled with anti-CD25PE, anti-HLA-DRFITC, and anti-CD3PerCP and analysed by FACS (Material and Methods). Values represent the measured percentages of CD25high, CD25low, and HLA-DR+cellson CD3+ cells. Shown are the results for the entire population of patients (A and D), plus the segregated results for the groups of rejecting (B and E) and non-rejecting (C and F) patients, where each dot corresponds to a single patient. The regression line between variables is shown. Pearson correlation coefficients (R) and (P) are indicated only when statistically significant. Center lines in B, C, E and F indicate the arbitrary threshold at 0.7% of CD3+ cells.