Download

1 / 27
271 likes | 399 Vues
Discover how LIGO e-Lab enhances classroom learning by utilizing seismic data from environmental sensors to study gravitational waves. This resource features interactive tools for data analysis, including seismometers, tiltmeters, magnetometers, and anemometers, enabling students to investigate earthquakes and their effects on gravitational wave detection. Through hands-on activities and collaborative research experiences, learners can plot seismic activity and analyze data from various sources, promoting engagement in physics and astrophysics. This project honors Tim Hardt's contributions to LIGO e-Lab.

E N D
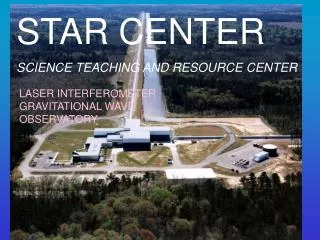
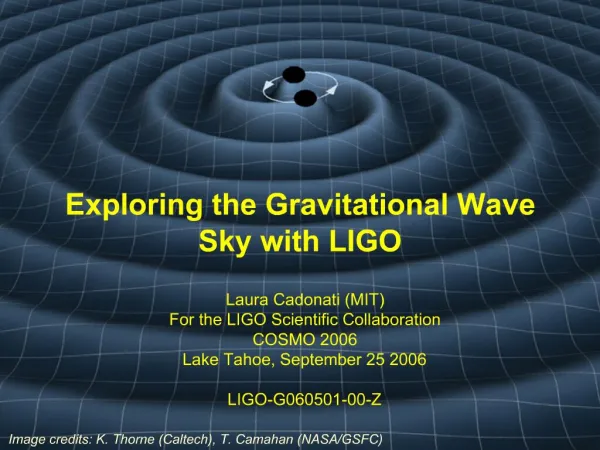
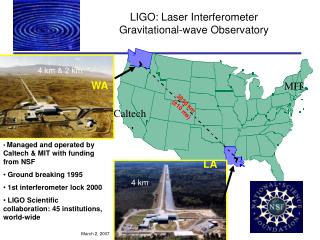
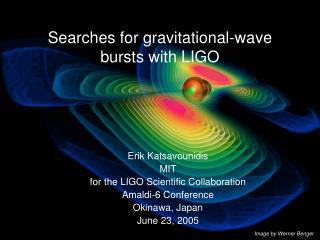
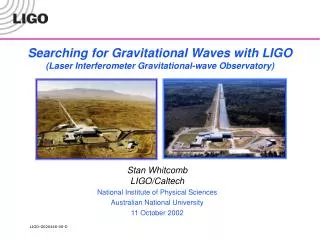
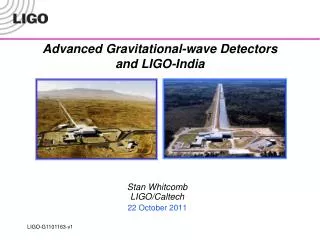
LIGO e-LabLaser Interferometer Gravitational Wave Observatory Using Seismic Data in the classroom. Colliding Black Holes" courtesy of Werner Benger, Zuse Institute Berlin, Max-Planck Institutue fuer Gravitational Physics (Albert Einstein Institute) and the Center for Computation & Technology at Louisiana State University.
LIGO Environmental Sensors: Seismometers Seismometers measure seismic waves that travel through the earth. A magnetic mass is suspended between two coils. As seismic waves pass through the seismometer, the coils move, but the mass remains at rest because of its inertia. The movement of the coils relative to the magnetic mass induces an electric current that can be detected and plotted on a graphical interface.
LIGO EnvironmentalSensors: Tiltmeters Tiltmeters measure small changes in the tilt of the ground or of a structure. Tiltmeters are analogous to a highly sensitive carpenter's level with an electronic output.
LIGO Environmental Sensors: Magnetometers Magnetometers measure changes in the Earth's magnetic field. Magnetometers can be used to monitor the effects of solar storms near the Earth. They can also be used to predict auroras.
LIGO Environmental Sensors: Anemometers Anemometers measure the velocity and direction of the wind at all five LIGO data stations.
EX MX Vault LVEA MY EY Location of Sensors
BASIC ADVANCED We have the option of plotting single sensor data in basic mode or multiple channel Plots in Advanced mode
First determine your investigation level. Beginning only allows one channel to be plotted on a graph. Both Intermediate and Advanced allow for multiple channels on one plot. Gathering Data using Bluestone Much of the content of the following group of slides appears in a tutorial that's in the e-Lab.
1) Choose site location 2) Choose data monitoring tool 3) Choose location of sensor Data Selection 4) Choose frequency of wave to plot
*No options for beginners* Click on “GO” Begin analysis
Just wait for plot to Be calculated and drawn Task execution
You may save the plot using these options Plotted graph of seismic activity
We have added a line for the actual time of the Earthquake and the calculated arrival time to LIGO.
The LIGO e-Lab is self contained and requires no external software to produce informational posters. In addition, student logbooks provides a platform to share research with other LIGO e-Lab users.
While the e-Lab stands on its own as a complete package of data, analysis tools, scaffolding and publishing functionality, the resource integrates well with other online capabilities. The following is an example project that adds Wikispace and Google mapping technology using free software. Adding functionality to the LIGO e-Lab experience to produce a collaborative research experience for middle and high school students.
Choose an Earthquake to investigate from USGS or other source
Date of earthquake • Time of earthquake • Latitude of earthquake • Longitude of earthquake • Magnitude of earthquake • Depth of focus of earthquake • Distance to LIGO • Estimated travel time of earthquake waves (USGS travel time calculator or rule of thumb) • Actual travel time of earthquake waves Information to gather
We have developed an auto plotting map for immediate feed back
For additional in-depth studies we have provided a collaborative map to minimize tedious re-work.
Each plotted point contains basic information and a link to an e-Lab Poster.
Each poster will provide additional information with links to source data and a link to the specific earthquake site map.
Map Plate boundaries. • Study how earthquake wave propagation velocities vary with rock types. • Graph earthquakes depth of focus. • Find tectonically blind areas in the data. • Compare earthquake intensity and depth. • …Insert your investigation here… What can we do with this information?
This project was inspired by Tim Hardt’sdiligent development and is continued in his honor. • Special thanks to LIGO e-Lab Hanford Washington for much of the information and pictures presented here. http://www18.i2u2.org/elab/ligo/home/project.jsp