Download
1 / 39
420 likes | 882 Vues
5-3 Inference on the Means of Two Populations, Variances Unknown. 5-3 Inference on the Means of Two Populations, Variances Unknown. 5-3 Inference on the Means of Two Populations, Variances Unknown. 5-3 Inference on the Means of Two

E N D
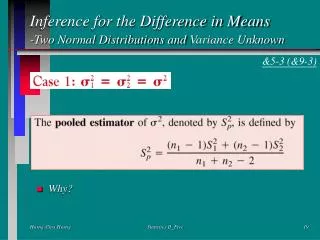
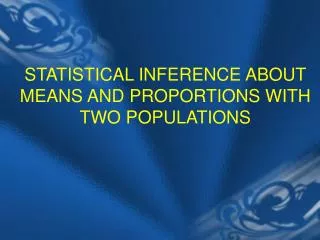
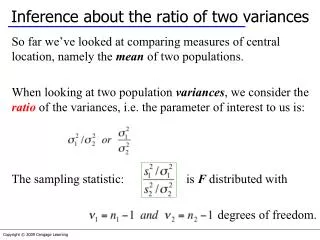
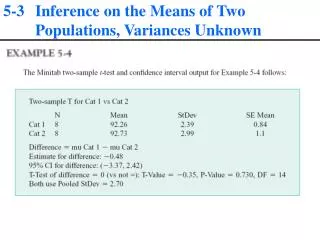
5-3 Inference on the Means of Two Populations, Variances Unknown
5-3 Inference on the Means of Two Populations, Variances Unknown
5-3 Inference on the Means of Two Populations, Variances Unknown
5-3 Inference on the Means of Two Populations, Variances Unknown OPTIONS NOOVP NODATE NONUMBER LS=80; PROCFORMAT; VALUE MR 0='PHX' 1='RuralAZ'; DATA ARSENIC; INPUT AREA ARSENIC @@; FORMAT AREA MR.; CARDS; 0 3 1 48 0 7 1 44 0 25 1 40 0 10 1 38 0 15 1 33 0 6 1 21 0 12 1 20 0 25 1 12 0 15 1 1 0 7 1 18 PROCTTEST DATA=ARSENIC; CLASSAREA; VAR ARSENIC; TITLE 'EXAMPLE 5-5'; RUN; QUIT;
5-3 Inference on the Means of Two Populations, Variances Unknown EXAMPLE 5-5 The TTEST Procedure Variable: ARSENIC AREA N Mean StdDevStd Err Minimum Maximum PHX 10 12.5000 7.6340 2.4141 3.0000 25.0000 RuralAZ 10 27.5000 15.3496 4.8540 1.0000 48.0000 Diff (1-2) -15.0000 12.1221 5.4212 AREA Method Mean 95% CL Mean StdDev PHX 12.5000 7.0390 17.9610 7.6340 RuralAZ27.5000 16.5195 38.4805 15.3496 Diff (1-2) Pooled -15.0000 -26.3894 -3.6106 12.1221 Diff (1-2) Satterthwaite-15.0000 -26.6941 -3.3059 AREA Method 95% CL StdDev PHX 5.2509 13.9367 RuralAZ10.5580 28.0224 Diff (1-2) Pooled 9.1596 17.9264 Diff (1-2) Satterthwaite Method Variances DF t Value Pr > |t| Pooled Equal 18 -2.77 0.0127 Satterthwaite Unequal 13.196 -2.77 0.0158 Equality of Variances Method Num DF Den DF F Value Pr > F Folded F 9 9 4.04 0.0494
5-3 Inference on the Means of Two Populations, Variances Unknown 5-3.1 Hypothesis Testing on the Difference in Means
5-3 Inference on the Means of Two Populations, Variances Unknown
5-3 Inference on the Means of Two Populations, Variances Unknown 5-3.2 Type II Error and Choice of Sample Size
5-3 Inference on the Means of Two Populations, Variances Unknown 5-3.3 Confidence Interval on the Difference in Means
5-3 Inference on the Means of Two Populations, Variances Unknown 5-3.3 Confidence Interval on the Difference in Means
5-3 Inference on the Means of Two Populations, Variances Unknown 5-3.3 Confidence Interval on the Difference in Means
5-3 Inference on the Means of Two Populations, Variances Unknown OPTIONS NOOVP NODATE NONUMBER LS=80; DATA EX520; INPUT TYPE TEMP @@; CARDS; 1 206 2 177 1 188 2 197 1 205 2 206 1 187 2 201 1 194 2 180 1 193 2 176 1 207 2 185 1 185 2 200 1 189 2 197 1 213 2 192 1 192 2 198 1 210 2 188 1 194 2 189 1 178 2 203 1 205 2 192 PROCSORT; BY TYPE; PROCUNIVARIATENORMAL PLOT; VAR TEMP; BY TYPE; TITLE 'NORMALITY CHECK'; PROCTTEST DATA=EX520 SIDES=U; CLASS TYPE; VAR TEMP; TITLE 'EXERCISE 520'; RUN; QUIT; EX 5-20 (P235)
5-3 Inference on the Means of Two Populations, Variances Unknown NORMALITY CHECK ------------------------------------ TYPE=1 ------------------------------------ UNIVARIATE 프로시저 변수: TEMP 적률 N 15 가중합15 평균 196.4 관측치 합 2946 표준편차 10.4799128 분산 109.828571 왜도 0.05341203 첨도 -1.126598 제곱합580132 수정 제곱합1537.6 변동계수 5.33600446 평균의 표준오차 2.70590184 정규성검정 검정 ----통계량---- -------p-값------- Shapiro-Wilk W 0.939894 Pr < W 0.3810 Kolmogorov-Smirnov D 0.194068 Pr > D 0.1304 Cramer-von MisesW-Sq 0.087134 Pr > W-Sq 0.1557 Anderson-Darling A-Sq 0.463122 Pr > A-Sq0.2270 NORMALITY CHECK ------------------------------------ TYPE=2 ------------------------------------ UNIVARIATE 프로시저 변수: TEMP 적률 N 15 가중합15 평균 192.066667 관측치 합 2881 표준편차 9.4375138 분산 89.0666667 왜도 -0.4020429 첨도 -0.9023837 제곱합554591 수정 제곱합1246.93333 변동계수 4.91366564 평균의 표준오차 2.43675558 정규성 검정 검정 ----통계량---- -------p-값------- Shapiro-Wilk W 0.947736 Pr < W 0.4895 Kolmogorov-Smirnov D 0.166088 Pr > D >0.1500 Cramer-von MisesW-Sq 0.043562 Pr > W-Sq>0.2500 Anderson-Darling A-Sq0.295176 Pr > A-Sq>0.2500
5-3 Inference on the Means of Two Populations, Variances Unknown • ------------------------------------ TYPE=1 ------------------------------------ • ------------------------------------ TYPE=2 ------------------------------------ 줄기 잎 # 상자그림 21 03 2 | 20 5567 4 +-----+ 20 | | 19 | + | 19 2344 4 *-----* 18 5789 4 +-----+ 18 | 17 8 1 | ----+----+----+----+ 값 : (줄기.잎)*10**+1 정규 확률도 212.5+ *++++* | * * * *+++ | +++++ | +++++ | +++** * * | * +*+* * | +++++ 177.5+ +++*+ +----+----+----+----+----+----+----+----+----+----+ -2 -1 0 +1 +2 줄기 잎 # 상자그림 20 6 1 | 20 013 3 +-----+ 19 778 3 | | 19 22 2 *--+--* 18 589 3 +-----+ 18 0 1 | 17 67 2 | ----+----+----+----+ 값 : (줄기.잎)*10**+1 정규 확률도 207.5+ +++*++ | * *++*+ | **+*+++ 192.5+ *+*+++ | *+*+* | +++*+ 177.5+ +*++++* +----+----+----+----+----+----+----+----+----+----+ -2 -1 0 +1 +2
5-3 Inference on the Means of Two Populations, Variances Unknown or Variable: TEMP TYPE N Mean StdDevStd Err Minimum Maximum 1 15 196.4 10.4799 2.7059 178.0 213.0 2 15 192.1 9.4375 2.4368 176.0 206.0 Diff (1-2) 4.3333 9.9723 3.6414 TYPE Method Mean 95% CL Mean StdDev 1 196.4 190.6 202.2 10.4799 2 192.1 186.8 197.3 9.4375 Diff (1-2) Pooled 4.3333 -1.8611 Infty9.9723 Diff (1-2) Satterthwaite4.3333 -1.8634 Infty TYPE Method 95% CL StdDev 1 7.6726 16.5279 2 6.9095 14.8839 Diff (1-2) Pooled 7.9138 13.4871 Diff (1-2) Satterthwaite Method Variances DF t Value Pr > t Pooled Equal 28 1.19 0.1220 Satterthwaite Unequal 27.698 1.19 0.1221 Equality of Variances Method Num DF Den DF F Value Pr > F Folded F 14 14 1.23 0.7004
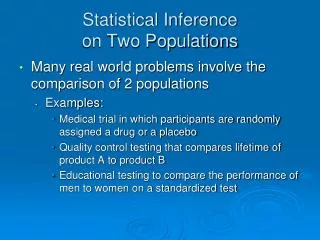
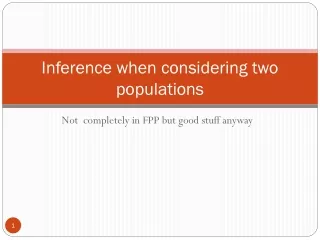
Inference on Two Population H0 : m1 = m2 YES NO Both n’s Large YES YES Both s’s Known Both X’s Normal NO NO Z –Test Normal Distribution Use S for s If s unknown Wilcoxon-Mann- Whitney Test NO YES s1 = s2 F Test t –Test Satterthwaite t –Test Pooled Variance
Inference on Two Population SampleProblem The number of visitors to Carlsbad Caverns were counted for a one-week period that included the forth of July in 2009 and in 2010. Treat these data as random samples and use the Wilcoxon-Mann-Whitney rank sum test to see if the mean number of visitors is the same for both years. Use and state the p-value.
Inference on Two Population 1. H0: m1 =m2 H1: m1m2 2. 3. Test Statistic where = = =0.5572 = 18.4761 4. Decision Rule: If |T|>T1-a, n1+n2-2, then Reject H0 T0.95, 12 = 1.7823 5. Conclusion: Since |T|=0.5572< T0.95, 12 = 1.7823, fail to reject H0. SR12 = 10.8095, SR1 = 3.29 SR22= 26.1428, SR2= 5.11
Inference on Two Population DATA CARLSBAD; INPUT YEAR COUNT @@; CARDS; 2009 397 2009 286 2009 268 2009 254 2009 571 2009 604 2009 384 2010 314 2010 257 2010 278 2010 252 2010 613 2010 646 2010 253 PROCUNIVARIATE DATA=CARLSBAD NORMAL; VAR COUNT; BY YEAR; TITLE 'PROBLEM ASSUMING NORMALITY'; PROCTTEST DATA=CARLSBAD; CLASS YEAR; VAR COUNT; PROCRANK DATA=CARLSBAD OUT=RANKED; VAR COUNT; PROCTTEST DATA=RANKED; CLASS YEAR; VAR COUNT; TITLE 'Problem using Wilcoxon-Mann-Whitney test'; RUN; QUIT;
Inference on Two Population PROBLEM ASSUMING NORMALITY ------------------------------------------ YEAR=2009 ------------------------------------------ UNIVARIATE 프로시저 변수: COUNT 적률 N 7 가중합7 평균394.857143 관측치 합2764 표준편차 142.987678 분산20445.4762 왜도0.67728241 첨도-1.3040573 제곱합1214058 수정 제곱합122672.857 변동계수 36.212509 평균의 표준오차54.0442625 정규성검정 검정----통계량---- -------p-값------- Shapiro-Wilk W 0.864041 Pr < W 0.1645 Kolmogorov-Smirnov D 0.208307 Pr > D >0.1500 Cramer-von Mises W-Sq 0.069546 Pr > W-Sq0.2470 Anderson-Darling A-Sq0.44369 Pr > A-Sq 0.2043 ------------------------------------------ YEAR=2010 ------------------------------------------ UNIVARIATE 프로시저 변수: COUNT 적률 N 7 가중합7 평균373.285714 관측치 합2613 표준편차 176.602864 분산31188.5714 왜도 1.18136027 첨도-0.8247496 제곱합1162527 수정 제곱합187131.429 변동계수 47.3103729 평균의 표준오차 66.7496083 정규성 검정 검정----통계량---- -------p-값------- Shapiro-Wilk W 0.70274 Pr < W 0.0040 Kolmogorov-Smirnov D 0.345737 Pr > D 0.0124 Cramer-von Mises W-Sq 0.187549 Pr > W-Sq0.0050 Anderson-Darling A-Sq1.012182 Pr > A-Sq <0.0050
Inference on Two Population The TTEST Procedure Variable: COUNT YEAR N Mean StdDevStd Err Minimum Maximum 2009 7 394.9 143.0 54.0443 254.0 604.0 2010 7 373.3 176.6 66.7496 252.0 646.0 Diff (1-2) 21.5714 160.7 85.8853 YEAR Method Mean 95% CL Mean StdDev 95% CL StdDev 2009 394.9 262.6 527.1 143.0 92.1403 314.9 2010 373.3 210.0 536.6 176.6 113.8 388.9 Diff (1-2) Pooled 21.5714 -165.6 208.7 160.7 115.2 265.2 Diff (1-2) Satterthwaite 21.5714 -166.5 209.6 Method Variances DF t Value Pr > |t| Pooled Equal 12 0.25 0.8059 Satterthwaite Unequal 11.502 0.25 0.8061 Equality of Variances Method Num DF Den DF F Value Pr > F Folded F 6 6 1.53 0.6210 _____________________________________________________________________________________ Problem using Wilcoxon-Mann-Whitney test The TTEST Procedure Variable: COUNT (Values of COUNT Were Replaced by Ranks) YEAR N Mean StdDevStd Err Minimum Maximum 2009 7 8.1429 3.2878 1.2427 3.0000 12.0000 2010 7 6.8571 5.1130 1.9325 1.0000 14.0000 Diff (1-2) 1.2857 4.2984 2.2976 YEAR Method Mean 95% CL Mean StdDev 95% CL StdDev 2009 8.1429 5.1022 11.1836 3.2878 2.1186 7.2399 2010 6.8571 2.1284 11.5859 5.1130 3.2948 11.2592 Diff (1-2) Pooled 1.2857 -3.7203 6.2917 4.2984 3.0823 7.0955 Diff (1-2) Satterthwaite1.2857 -3.8176 6.3890 Method Variances DF t Value Pr > |t| Pooled Equal 12 0.56 0.5861 Satterthwaite Unequal 10.237 0.56 0.5878 Equality of Variances Method Num DF Den DF F Value Pr > F Folded F 6 6 2.42 0.3067
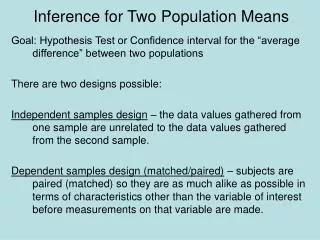
5-4 The Paired t-Test • A special case of the two-sample t-tests of Section 5-3 occurs when the observations on the two populations of interest are collected in pairs. • Each pair of observations, say (X1j, X2j), is taken under homogeneous conditions, but these conditions may change from one pair to another. • The test procedure consists of analyzing the differences between hardness readings on each specimen.
5-4 The Paired t-Test OPTIONS NOOVP NODATE NONUMBER LS=80; DATA STRENGTH; INPUT K L @@; DIFF = K-L; CARDS; 1.186 1.061 1.151 0.992 1.322 1.063 1.339 1.062 1.2 1.065 1.402 1.178 1.365 1.037 1.537 1.086 1.559 1.052 PROCUNIVARIATE DATA=STRENGTH NORMAL; VAR DIFF; TITLE 'PAIRED T-TEST BY PROC UNIVARIATE'; PROCTTEST DATA=STRENGTH; PAIRED K*L; TITLE 'PAIRED TTEST BY PROC TTEST'; RUN; QUIT;
5-4 The Paired t-Test PAIRED T-TEST BY PROC UNIVARIATE UNIVARIATE 프로시저 변수: DIFF 적률 N 9 가중합9 평균 0.27388889 관측치 합 2.465 표준편차 0.13509945 분산 0.01825186 왜도 0.70116761 첨도 -0.5595974 제곱합0.821151 수정 제곱합0.14601489 변동계수 49.3263708 평균의 표준오차 0.04503315 위치모수검정: Mu0=0 검정 --통계량--- -------p-값------- 스튜던트의 t t6.081939 Pr > |t| 0.0003 정규성 검정 검정 ----통계량---- -------p-값------- Shapiro-Wilk W 0.916781 Pr < W 0.3663 Kolmogorov-Smirnov D 0.157481 Pr > D >0.1500 --------------------------------------------------------------------------------------------------- PAIRED TTEST BY PROC TTEST The TTEST Procedure Difference: K - L N Mean StdDevStd Err Minimum Maximum 9 0.2739 0.1351 0.0450 0.1250 0.5070 Mean 95% CL Mean StdDev 95% CL StdDev 0.2739 0.1700 0.3777 0.1351 0.0913 0.2588 DF t Value Pr > |t| 8 6.08 0.0003
5-4 The Paired t-Test Paired Versus Unpaired Comparisons
5-4 The Paired t-Test Confidence Interval for D
5-4 The Paired t-Test Sample Example: An insurance adjuster wants to compare estimates from two different repair garages for minor repairs on automobiles. Thirteen pairs of estimated are available. State the appropriate null and alternative hypothesis to see if there is any difference in the mean estimated of the two garages. Let a =0.05 and test the null hypothesis with the Wilcoxon signed ranks test. State the p-value. Check the differences in estimates from the two garages for normality. Based on the results of part (b), the paired t test should not be applied to these data: however, compute the paired t test to test the null hypothesis on part (a) and compare it with the results of the Wilcoxon signed ranks test. SD = 11.6619
5-4 The Paired t-Test 1. H0: mD = 0 H1: mD≠ 0 2. 3. Test Statistic (Wilcoxon Signed Ranks Test) where 4. Decision Rule: Reject if |T|>Ta/2, n-1. Here, t0.025, 12 = 2.178. 5. Conclusion = = 2.55 Since T=2.55> t0.025, 12 = 2.178, reject H0. = 4.69 SR= 6.63
5-4 The Paired t-Test OPTIONS NOOVP NODATE NONUMBER LS=80; DATA INSURE; INPUT FIRST SECOND @@; DIFF=FIRST-SECOND; IF DIFF<0 THEN IND=1; ELSE IND=0; ABSDIFF=ABS(DIFF); CARDS; 165 139 156 132 165 134 135 133 134 130 131 133 130 130 126 125 120 122 120 119 118 114 115 116 108 105 PROCUNIVARIATE DATA=INSURE NORMAL; VAR DIFF; TITLE 'normality check and t-test'; PROCRANK DATA=INSURE OUT=RINSURE; VAR ABSDIFF; DATA RINSURE; SET RINSURE; IF IND=1 THEN ABSDIFF=-ABSDIFF; PROCUNIVARIATE DATA=RINSURE; VAR ABSDIFF; TITLE 'Wilcoxon Signed Ranks Test'; RUN; QUIT;
5-4 The Paired t-Test normality check and t-test UNIVARIATE 프로시저 변수: DIFF 적률 N 13 가중합13 평균 7 관측치 합 91 표준편차 11.6619038 분산 136 왜도 1.40385807 첨도 0.31339454 제곱합2269 수정 제곱합1632 변동계수 166.598626 평균의 표준오차 3.23443016 위치모수 검정: Mu0=0 검정 --통계량--- -------p-값------- 스튜던트의 t t2.164214 Pr > |t| 0.0513 부호 M 3 Pr >= |M| 0.1460 부호 순위 S 27 Pr >= |S| 0.0332 정규성 검정 검정 ----통계량---- -------p-값------- Shapiro-Wilk W 0.714134 Pr < W 0.0008 Kolmogorov-Smirnov D 0.370737 Pr > D <0.0100 Cramer-von Mises W-Sq 0.335966 Pr > W-Sq <0.0050 Anderson-Darling A-Sq 1.740466 Pr > A-Sq <0.0050
5-4 The Paired t-Test Wilcoxon Signed Ranks Test UNIVARIATE 프로시저 변수: ABSDIFF (Values of ABSDIFF Were Replaced by Ranks) 적률 N 13 가중합13 평균 4.69230769 관측치 합 61 표준편차 6.63494053 분산 44.0224359 왜도 -0.50062 첨도 -1.0648238 제곱합814.5 수정 제곱합528.269231 변동계수 141.400372 평균의 표준오차 1.84020141 위치모수 검정: Mu0=0 검정 --통계량--- -------p-값------- 스튜던트의 t t 2.549888 Pr > |t| 0.0255 부호 M 3.5 Pr >= |M| 0.0923 부호 순위 S 30.5 Pr >= |S| 0.0310