Download
1 / 39
390 likes | 649 Vues
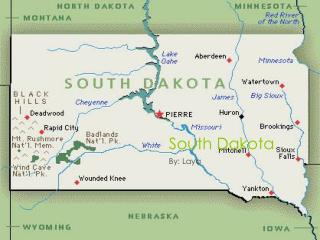
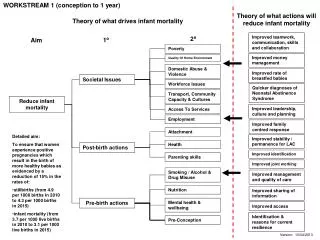
Infant mortality in South Dakota. Tribal Conference on Health Data 15 March 2011 Pierre, South Dakota Lon Kightlinger, MSPH, PhD State Epidemiologist. Outline World, National, State, County rates Goals Neonatal and post-neonatal mortality Historical trends Race disparities

E N D
Infant mortality in South Dakota Tribal Conference on Health Data 15 March 2011 Pierre, South Dakota Lon Kightlinger, MSPH, PhD State Epidemiologist • Outline • World, National, State, County rates • Goals • Neonatal and post-neonatal mortality • Historical trends • Race disparities • Prenatal care • Risk factors: gestational age, birth weight, tobacco • Causes of infant death Guernica (Picasso, 1937) “No more shall there be an infant that lives but a few days, or an old person who does not live out a lifetime. (Is: 65: 20)
Infant mortality definitions • Infantdeath: death of a live-born infant less than one year (365 days) of age. • Neonataldeath: death of a live-born infant from birth to 27 days old. • Post-neonataldeath: death of an infant occurring 28 days to one year of age. • Infant, neonatal or post-neonatal rates: number of deaths divided by total number of live births X 1,000.
Data sources • The SD Department of Health is legally responsible for registration of births and deaths in the state. • Birth reports are the responsibility of the person in attendance at the birth and usually completed by medical records personnel. • The cause of death and details are determined and documented by a local physician or coroner who submits the death certificate (ICD coded). • Birth and death statistics are reported annually by demographic stratification as aggregate numbers and rates. http://doh.sd.gov/Statistics/2008Vital • Birth and Death registry files are linked and merged.
Infant mortality rates, United States, 2004-2006 Massachusetts 4.9 Utah 5.0 Minnesota 5.0 Washington 5.1 California 5.2 Iowa 5.2 New Jersey 5.4 Vermont 5.6 N. Hampshire 5.6 Oregon 5.6 Connecticut 5.8 New York 5.9 Nebraska 5.9 North Dakota 5.9 Montana 6.0 Rhode Island 6.0 Hawaii 6.1 New Mexico 6.1 Colorado 6.1 Nevada 6.2 Maine 6.3 Wisconsin 6.3 Idaho 6.3 Texas 6.3 Alaska 6.5 Arizona 6.6 Kentucky 7.0 Florida 7.2 South Dakota 7.3 Kansas 7.3 Virginia 7.3 Wyoming 7.4 Illinois 7.4 Pennsylvania 7.4 Missouri 7.5 Michigan 7.6 West Virginia 7.6 Ohio 7.8 Maryland 7.9 Indiana 7.9 Oklahoma 8.0 Georgia 8.2 Arkansas 8.2 North Carolina 8.5 Delaware 8.6 Tennessee 8.7 South Carolina 9.0 Alabama 9.1 Louisiana 10.0 Mississippi 10.6 Ref: NCHS, NVSS, NVSR 58(17)
Infant mortality rates, South Dakota, 2000-2009 Beadle 6.1 Hand 6.3 Lawrence 6.3 Minnehaha 6.5 Aurora 6.5 McCook 6.5 Yankton 6.6 Perkins 6.7 Butte 6.9 Hughes 6.9 Pennington 7.0 Total 7.0 Kingsbury 7.1 Hamlin 7.2 Grant 7.6 Bennett 7.7 Stanley 7.8 Jones 8.3 Dewey 8.7 Marshall 8.8 Meade 9.6 Fall River 9.7 Gregory 9.8 Roberts 10.1 Buffalo 11.2 Todd 11.2 Moody 11.7 Lyman 11.9 Charles Mix 12.1 Corson 13.8 Shannon 15.2 Jackson 15.7 Ziebach 16.0 Mellette 18.5 Campbell 0.0 Haakon 0.0 Harding 0.0 Hyde 0.0 Jerauld 0.0 Miner 0.0 Lake 2.4 Union 2.9 Brule 3.0 Douglas 3.1 Clay 3.2 Hutchinson 3.7 Sanborn 3.8 Hanson 3.8 Faulk 4.1 Potter 4.1 McPherson 4.6 Edmunds 4.6 Clark 4.7 Codington 4.8 Bon Homme 5.0 Sully 5.0 Spink 5.0 Brookings 5.5 Davison 5.5 Brown 5.5 Tripp 5.5 Lincoln 5.5 Turner 5.6 Custer 5.6 Deuel 5.8 Walworth 6.0 Day 6.1
2020 Goal:Improve birth outcomes and health of infants, children and adolescents.Performance measures:Reduce the infant mortality rate to 6 by 2020.Increase proportion of pregnant women who receive prenatal care in the first trimester from 68.9% in 2008 to 75% by 2020.Reduce teen pregnancy rate from 21 per 1,000 teens age 15-17 in 2008 to 15 by 2020. Guiding Principles Reduce Health Disparities Maximize use of Technology Emphasize Customer Service Work in Partnership
United States rates - Infant (under 1 year): 6.7 - Neonatal (birth to 27 days): 4.5 - Post neonatal (28 days – 1 year): 2.2 2020 Target Goals - Infant mortality 6.0 - Neonatal mortality 4.1 - Post neonatal mortality 2.0
Infant mortality rates,(infant deaths per 1,000 live births)South Dakota, 1912-2009
Infant deaths and infant mortality rates, South Dakota, 1960-2009 Source: SDDOH, ODSVR
Neonatal and post-neonatal mortality rates, SD 1990 – 2009(deaths per 1,000 live births) SD-DOH SDVSR
Race disparity: comparing percent of infant deaths to all live births. Infant deaths2000-2009 506 White 64% 255 American Indian, 32% 26 Black, 3% 6 Other, 1% TOTAL: 794 All live births2003-2009
Infant mortality disparity, South Dakota, 2000 – 2009 (Infant deaths per 1,000 live births) Native American White SD-DOH SDVSR
Neonatal and post-neonatal mortality by race, South Dakota, 1990 – 2009 (Infant deaths per 1,000 live births) SD-DOH SDVSR
Neonatal and Postneonatal mortality rates 1. Infant mortality statistics, 2006, National Vital Statistics reports, 30 April 2010 2. SD Dept of Health DSVR.
Age at time of infant death, South Dakota, 2000-2009 39% died during their first day. 48% died during their first week. 57% died during their first month (neonatal period). 90% died during their first 6 month. 10% died during the last 6 months of their first year. 43% died during months 1-11 (post-neonatal period). ---------------- First month -------------- ------- First week -------- First day
Age at time of American Indian infant deaths, South Dakota, 2000-2009 29% died during their first day. 34% died during their first week. 42% died during their first month (neonatal period). 88% died during their first 6 month. 12% died during the last 6 months of their first year. 58% died during months 1-11 (post-neonatal period). ---------------- First month -------------- ------- First week -------- First day
Prenatal care, month started: comparing percent of infant deaths to all live births, 2006-2009 58% 1st trimester care Infant deaths (325) 4% no care 68% 1st trimester care All live births (48,171) 0.1% no care
American Indian Prenatal care, month started:comparing percent of infant deaths to all live births, 2006-2009 40% 1st trimester care Am Indian Infant deaths (100) 6% no care 49% 1st trimester care All Am Indian live births (8,817) 3% no care
Mothers receiving 1st trimester prenatal care 2005-9, State rate 71% Yankton 85% Deuel 85% Union 85% Codington 81% Clay 80% Davison 80% Campbell 80% Brown 79% Hand 79% Brookings 79% Aurora 79% Lincoln 79% Sully 78% BonHomme 78% Jones 78% Lawrence 78% Sanborn 78% Lake 78% Harding 78% Meade 78% Potter 77% Kingsbury 77% Hyde 76% Turner 76% Butte 76% Edmunds 74% McCook 74% Hamlin 74% Miner 74% Stanley 74% Day 73% Pennington 73% Hughes 73% Douglas 73% Grant 73% Hanson 71% Custer 71% Haakon 71% Minnehaha 70% Gregory 69% Brule 69% Walworth 69% Spink 68% Jerauld 68% Tripp 67% Hutchinson 65% Perkins 65% Moody 64% Charles Mix 63% McPherson 63% Marshall 63% Faulk 62% Beadle 61% Fall River 60% Clark 60% Dewey 58% Lyman 57% Jackson 55% Shannon 55% Roberts 54% Ziebach 53% Corson 51% Buffalo 47% Bennett 47% Mellette 46% Todd 41% 2010 SD Kits Count Factbook SD-DOH Vital Stats
Gestational age: comparing infant deaths to all live births, 2000-2009 Infant deaths All live births
Gestational age: comparing American Indian and White infants, 2000-2009 Am Indian infants White infant
Characteristics of infant deaths and all SD births, South Dakota 2000-2009
Age and marital status of mother: comparing percent of infant deaths to all live births Infant deaths (790) All live births (48,116)
Age of American Indian mothers, South Dakota, 2000-2009 Am IndianInfant deaths (255) All Am Indian live births (20,420)
Mothers who smoked during pregnancy, 2002 South Dakota (19.3%) Overall U.S. (11.4) SOURCE: (MMWR 8 Oct 2004 53: 911-915)www.cdc.gov/mmwr/preview/mmwrhtml/mm5339a1.htm
Smoking during pregnancy, South Dakota, 2006-2009 Source: SD-DOH DSVR, unknowns not in denominator
Smoking during pregnancy by age, South Dakota, 2006-2009 Source: SD-DOH, unknowns not in denominator
Smoking during pregnancy by race, South Dakota, 2006-2009 Source: SD-DOH, unknowns not in denominator
Leading causes of infant death by race (number of deaths), South Dakota, 2000-2009
Leading causes of infant death by race (rate per 1,000 births),South Dakota, 2000-2009
Leading individual causes of American Indian infant death, South Dakota, 2000-2009
SIDS, non-SIDS deaths and SIDS death rate*, US and South Dakota, 1982-2009 *SIDS deaths per 1,000 live births
SIDS by gender and race, South Dakota, 2000-2009, compared to United States rates per 1,000 live births, 2006
SIDS mortality rates by race, South Dakota, 2000-2009 Race disparities are evident in SIDS. In 2006 the national rate of SIDS deaths was 0.55 per 1,000 live births with the race stratification showing the SIDS mortality rate for white infants at 0.56, American Indian 1.19, Black 1.04, Asian 0.53 and Hispanic 0.27([1]). In South Dakota over half of SIDS victims were American Indian infants during the past decade. The South Dakota 10-year SIDS rates were 0.56 for white infants, 2.79 for American Indians and 1.20 for Black infants. The chart below shows the decreasing trend of American Indian SIDS deaths over the past decade, while the white SIDS rate, albeit lower, remained flat.
Strategies to reduce infant mortality Enhance promotion of: • Preconception health for women of childbearing age. • Proper nutrition and weight gain for pregnant women. • Assessment and referral for tobacco cessation and drug/alcohol services. • Awareness of pregnancy and early prenatal care. • Teen pregnancy prevention. • Breastfeeding as the best choice. • Infant safe sleep. • Parent education related to infant care, safety, immunizations, and parenting. Expand: • Home visiting and case management services for pregnant women and postpartum women and their families.
QUESTIONS ? THANK YOU
Birth Weight: comparing infant deaths to all live births, 2000-2009 Infant deaths All live births