Radiochemistry
Radiochemistry. The purpose of this experiment is to use first-order nuclear decay kinetics to determine the half-life of a nuclear reaction. Where might we see radioactive materials in everyday life?. Nuclear Energy. Smoke Detectors. Americium-241.

Radiochemistry
E N D
Presentation Transcript
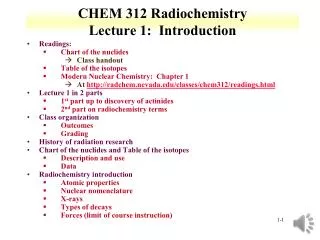
Radiochemistry The purpose of this experiment is to use first-order nuclear decay kinetics to determine the half-life of a nuclear reaction.
Where might we see radioactive materials in everyday life? Nuclear Energy Smoke Detectors Americium-241 Smoke from a fire can be detected at a very early stage At a nuclear power station, water vapor rises from the hyperboloid shaped cooling towers. The nuclear reactors are inside the cylindrical containment buildings. There is a reactor in Fulton, MO.
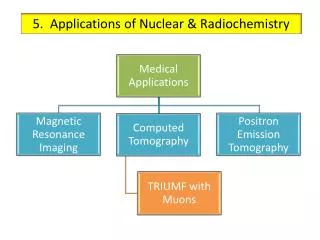
Where might we see radioactive materials in everyday life? Agricultural applications-radioactive traces Food irradiation Gamma rays of a radioisotopes (Cobalt-61) destroy many disease-causing bacteria as well as those that cause food to spoil Helps scientists to understand the detailed mechanism of how plants utilize phosphorous to grow an reproduce But what is radioactivity?
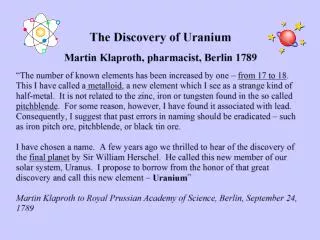
Discovery of Radioactivity In 1897, Becquerel accidentally discovered radioactivity in pitchblende (a uranium mineral) while studying sunlight induced fluorescence of various minerals. This mineral was found to produce a photographic image, even through black paper. Henri Antoine Becquerel French Professor of Applied Physics Nobel Prize in Physics 1903 (1852 – 1908) Further experiments demonstrated that a mixture of charged particles and electromagnetic radiation were being emitted and were responsible for the effect on photographic film.
Radioactivity & The Curies • Studied radioactive materials, particularly pitchblende, which was more radioactive than the uranium extracted from it. • Deduced (1898) the obvious explanation: Pitchblende must contain traces of some unknown radioactive component that was farmore radioactive than uranium. Pierre Curie – French Physicist Nobel Prize in Physics – 1903 (May 15, 1859, – April 19, 1906) Marie Sklodowska Curie Polish/French Physicist & Chemist Nobel Prize in Physics – 1903 Nobel Prize in Chemistry - 1911 (November 7, 1867 – July 4, 1934)
The Curies refined several tons of pitchblende (shown above) progressively concentrating the radioactive components. Eventually they isolated the chloride salts of the two new chemical elements, and then the elements themselves. The first they named polonium(Po) after Marie's native country Poland; and, the other they named radium (Ra) from its intense radioactivity.
Rutherford – The Father of Nuclear Physics • Pioneered the orbital theory of the atom, in his discovery of “Rutherford scattering” off the nucleus with the gold foil experiment. • Demonstrated that radioactivity was the spontaneous disintegration of atoms. • First to note that in a sample of radioactive material it invariably took the same amount of time for half the sample to decay, thus defining its “half-life”. Ernst Rutherford Nuclear Physicist – New Zealand Nobel Prize in Chemistry - 1908 (August 30, 1871 – October 19, 1937)
Implications of Radioactivity • Radioactive materials undergoing nuclear decay reactions violated the idea that atoms are the unchanging, indivisible, ultimate building blocks of matter. • Additional experiments with cathode ray tubes, accelerators and mass spectrometers eventually showed atoms do consist of smaller components: protons, neutrons, and electrons.
Some Important Terminology • Nuclear reactions involve the atomic nucleus (i.e., protons and neutrons). • Regular chemical reactionsinvolve only the outer electrons of atoms. • An atom is the smallest entity that retains the properties of an element. • Atoms are composed of one or more electrons and a nucleus. • The nucleus is the central portion of an atom and contains one or more protons and zero or more neutrons.
Element= The simplest stable building blocks of materials, consisting of protons, neutrons and electrons. • Isotope = An atom of an element with the same number of protons, but a different number of neutrons.* • Radioisotope = An unstable isotope that undergoes nuclear decay. • Radiochemistry= The study of radioisotopes. *Note:Atomic weights given on the periodic table are the weighted average of all the natural isotopes of each element, as determined using mass spectrometry.
A X Z Nuclear Notation For example: A= mass number (sum of protons + neutrons) X= element symbol Z= atomic number (number of protons or charge)
Isotopes are atoms that have identical atomic numbers but different mass numbersas the result of differing numbers of neutrons. carbon-12 carbon-13 For each carbon isotope, there are how many… electrons?protons? neutrons?
The Chart of the Nuclides • As the number of protons, Z, increases the neutron to proton ratio required for nuclear stability also increases. • Nuclides with Z > 83(Bismuth) are unstable. • Light nuclides are stable when the neutron to proton ratio is close to one. • Even numbers of protons and neutrons seem to favor nuclear stability. • Certain specific numbers of protons or neutrons produce highly stable nuclides. The magic numbers are 2, 8, 20, 28, 50, 82,and 126.
Thermodynamics When the energies of all 2850 isotopes are plotted vs. their charge density, the nuclides form a parabola. The free neutron has the highest M/A & is unstable. It decays to form a proton, 1H, in 10.6 minutes. As the radioactive elements decay, they go from higher M/A values to lower M/A values thus becoming more thermodynamically stable. The 56Fe atom has the lowest value of M/A. So all elements on the periodic table beyond 56Fe, must have been formed by a Super Nova. The open symbols are radioactive nuclides; the filled symbols are stable and long lived.
The “Cradle of the Nuclides” results when the chart of the nuclides and the parabolas are combined into one 3-D graph. It shows the ground states of all stable and radioactive nuclides. The stable and long-lived nuclides are located in the valley. The radioactive nuclides or those easily destroyed by fusion or fission occupy higher positions in the cradle.
Most Common Particles Emitted by Radioactive Materials • Alpha = a helium nucleus, • Beta = an electron, • Gamma = electromagnetic radiation • Neutron = a neutral particle, with mass of about 1 amu or ~1 proton
Beta Decay Alpha Decay Occurs in nuclei with a high neutron:proton ratio. Occurs in nuclei with Z > 83. The loss of two protons and two neutrons moves the atom down and to the left toward the belt of stable nuclei. A neutron is converted into a proton inducing a shift down and to the right on the stability plot.
Positron Decay Electron Capture Decay Occurs in nuclei with a low neutron to proton ratio. Electron capture is common in heavier elements that have a low neutron to proton ratio. Gamma-ray Decay Gamma-ray decay generally accompanies another radioactive decay process because it carries off any excess energy within the nucleus resulting from the radioactive decay. A proton decays into a neutron and an electron inducing a shift up and to the left in the nuclear stability plot.
All particles produced by the decay of an atomic nucleus have the energy needed to penetrate substances - but to very differing distances.
Balancing Nuclear Decay Reactions Radioactive decay results in a redistribution of the basic nuclear particles. The nuclear notation system keeps track of where they are both before and after a nuclear transformation has taken place. To balance a nuclear decay reaction two rules must be followed. 1. Mass number is conserved in a nuclear decay reaction. The sum of the mass numbers before the decay must equal the sum of the mass numbers after the decay. 2. Electric charge is conserved in a nuclear decay reaction. The total electric charge on subatomic particles and nuclei before and after the decay must be equal.
Kinetics of Nuclear Decay • Radioactive decay processes and many chemical reactions show a direct correlation between the rate of reaction and the amount of reactant present. • That is, if the amount of reactant is changed, the rate of reaction changes by the same amount. • Rate = (slope) • dN/dt = -kN
The rate (slope) decreases with time and amount remaining. The decay rate expresses the speed at which a substance disintegrates. N : The number of nuclei remaining NO : The number of nuclei initially present k : The rate of decay t : the amount of time, t.
Linear Form of the Decay Equation ln N / No = -kt If we rearrange the equation ln N / No = -kt we can get it in the form of a straight line: y = mx + b
Linear Form of the Decay Equation ln N / No = -kt ln N - ln No = - ktln N = - kt+ ln No This is the equation of a straight line, y = mx + b where y = ln N (N = any given amount) m = -k x = t b = ln No (No = the initial amount) The linear form is useful for finding the initial amount present when t = 0 data was not measured.
Half Life Calculations Another characteristic of a radioactive process is the half life. The half life of a radioactive substance is the time required for half of the initial number of nuclei to disintegrate. Half life Rate of decay Phosphorous-32 has a half life of 14.7 days
Example The half life of a specific element was calculated to be 5200 years. Calculate the decay constant (k).
Example The half life of a specific element was calculated to be 5200 years. Calculate the decay constant (k). Recall: ln 2 = 0.693 So…
Example The half life of a specific element was calculated to be 5200 years. Calculate the decay constant (k). Recall: ln 2 = 0.693 So…
What about calculating lifetimes other than the half-life? How would you calculate the t3/4 or t7/8? * *Notice that this is the reciprocal of ln (n/no) which was equal to –kt. Therefore, If you know the specific decay constant, k, you know the half-life, t1/2. OR If you know the half-life, t1/2, you know the specific decay constant, k.
Today’s Experiment – Part 1 • Computer Simulation: • Run simulation for unknown sample number assigned by TA. • Copy data into Excel. (Record data in book or plan to print a copy.) • Obtain second set of simulation data from your lab partner. • Plot in Excel exponential decay curve and linear plot for both sets of data. • (So you should have 4 scatterplot graphs for the simulation data) • Fit trendline equations to all 4 plots and use these to determine the k, t1/2 • lnAo and Aofor both of the unknowns. Sign in using your assigned unknown number. Press start. Minutes are simulated – stop at 32 simulated minutes.
Today’s Experiment – Part 2 • Hands-On Activity: • Check out dice from the stockroom – 1 set for lab partners to share. • Roll dice to determinedecay curve for unknown numbers assigned by TA. • (Record data on handout.) • Obtain three sets of data for each set of unknown numbers. • Calculate the average for each roll. Record. • Calculate the natural log of the average for each roll. Record. • Plot by hand the exponential decay curve and linear plot • for your average data for all 3 sets of data. • (Plot these 3 sets of data on the scatterplot graphs provided in the postlab handout.) • Calculate the k, t1/2 and the initial activity, lnAo& Ao for each of the runs. • Show calculations for single run. Record values on datasheets. • Calculate the percent error for the half life, t1/2,for all 3 of the unknown sets. • Show calculations for single run. Record values on datasheets. • Answer Postlab questions.
March 26-30: No Class – Spring Break For April 2-5: 1. Turn in Nuclear Decay Lab (pp 27, 31-32) and 4 Graphs for Simulation Data and Hands-on Activity Datasheets &Postlab. 2. Read over Colorimetry (pp 45-58).