Investigating the Mysterious February/March PM2.5 Peak in Eastern U.S. Air Quality
80 likes | 196 Vues
This report discusses an unexplained seasonal peak in PM2.5 levels observed during February and March across the Eastern U.S. The analysis utilizes data from AIRNOW, detailing real-time air quality monitoring since 2002. Distinct peaks are noted for the Northeast, Great Lakes, and Great Plains, while absent in the South and West. The report aims to characterize this phenomenon, seeking community collaboration for further analysis. Satellite data from POLDER and MISR also support findings of a significant aerosol signal coinciding with this mysterious peak.

Investigating the Mysterious February/March PM2.5 Peak in Eastern U.S. Air Quality
E N D
Presentation Transcript
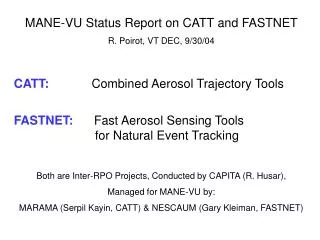
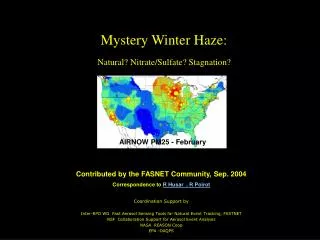
FASTNET Report: 0409FebMystHaze Mystery Winter Haze: Natural? Nitrate/Sulfate? Stagnation? AIRNOW PM25 - February Contributed by the FASNET Community, Sep. 2004 Correspondence to R Husar , R Poirot Coordination Support by Inter-RPO WG Fast Aerosol Sensing Tools for Natural Event Tracking, FASTNET NSF Collaboration Support for Aerosol Event Analysis NASA REASON Coop EPA -OAQPS
Secondary MP25 Peak in February-March • The AIRNOW PM25 data are available real-time for 300+ stations since July 2002. • The 30-day smoothing of the average hourly data shows the Eastern US PM25 seasonality • The seasonal pattern shows the summertime sulfate peak and a second Feb/Mar peak • The the existence, characteristics and origin of this regional peak is not known • The objective of effort is to characterize this ‘mysterious’ phenomenon over the EUS • The approach is to seek out the community as a resource for collaborative analysis Sulfate-driven Jul-Aug peak Feb-Mar peak, of unknown origin
Seasonal PM25 by Region The 30-day smoothing average shows the seasonality by region The Feb/Mar PM25 peak is evident for the Northeast, Great Lakes and Great Plains This secondary peak is absent in the South and West
PM25 Monthly Concentration AIRNOW Jul 02-Sep 04 Blue: 0 Red: 25 • Monthly average PM25 are shown as circle and contour (Blue: 0; Red: 25 mg/m3) • The Feb/Mar peak is clearly evident in the Upper Midwest region MAR APR JAN FEB MAY JUN JUL AUG SEP OCT NOV DEC
EPA AIRS 1999-2002 FRM PM25 Monthly Concentration • Monthly average FRM PM25 are shown as circle and contour (Blue: 0; Red: 25 mg/m3) • The Feb/Mar peak is clearly evident in the Midwest region; also in January • Hence, there is some deviation in peak location and time among the networks MAR APR JAN FEB MAY JUN JUL AUG SEP OCT NOV DEC
Satellite Data: POLDER Aerosol Polarization Index Dauze et. al, 2001 • The (short-lived, Nov 96-Jun97) POLDER satellite sensor measured the of aerosol polarization, which is sensitive to fine particles, < 1 mm • For Jan-Mar the data show a strong aerosol signal over the Upper Midwest and adjacent Canada • Skeptics have attributed the ‘anomalous’ aerosol zone to interferences such as snowy ground reflectance • In light of the recent ground-based PM25 monitoring data, the early (1997) POLDER results deserve full attention
Satellite Data: MISR Aerosol Optical Thickness • The MISR sensor on Terra satellite performs multi-angle (60-150 deg?) scans for aerosol retrieval • Four years of AOT data over land (2001-04) provide further evidence of the Jan-Mar aerosol peak • Interestingly, both POLDER and MISR show the aerosol patch extending deep into Central Canada
Where do we go from here? • Is it real ???