These particles have something in common
450 likes | 488 Vues
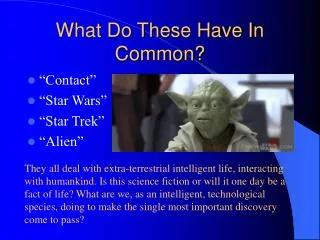
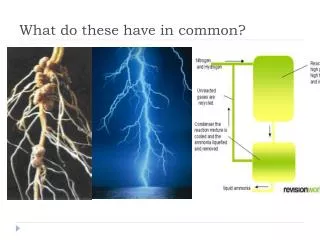
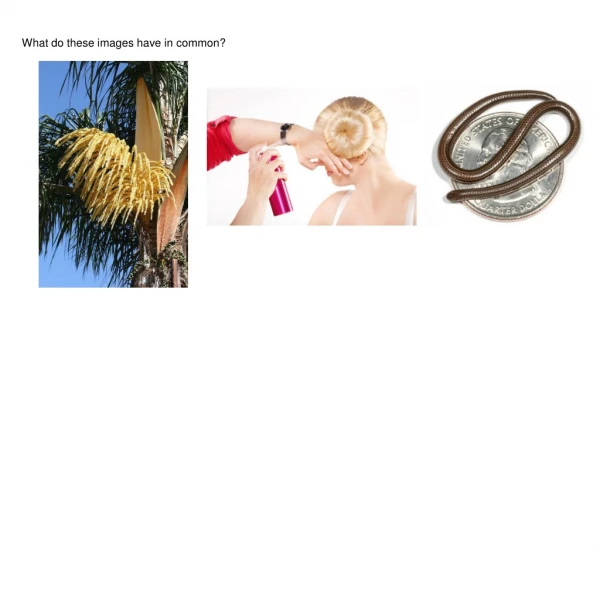
These particles have something in common. Blood cells. Chromosom es. Protozoa. Algae. Certain parameters of these particles can be measured with a flow cytometer. Which parameters can be measured?. the relative size (Forward Scatter - FSC )

These particles have something in common
E N D
Presentation Transcript
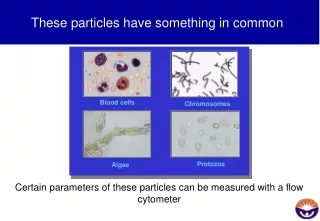
These particles have something in common Blood cells Chromosomes Protozoa Algae Certain parameters of these particles can be measured with a flow cytometer
Which parameters can be measured? • the relative size (Forward Scatter - FSC) • the granularity or complexity (Side Scatter - SSC) • the fluorescence intensity (FL1, FL2, up to FL X)
Forward scatter Cell size (488 nm) Coherent lightsource (488 nm) Side scatter Granularity (488 nm) Characteristics of FSC and SSC • Side scatter (SSC) • measuredin 90° direction to the excitation light • proportional to cell „complexity“ or granularity • Forward scatter (FSC) • measured along the axis of the incoming light • proportional the the cell size / cell surface (only true for perfect round cells)
An example of light scatter: Granulocytes Side scatter Monocytes Lymphocytes Debris Forward scatter
Fluorescence l=488 nm l=530 nm Excitation light Emission light • The fluorochrome molecule absorbes the energy of the incoming light • It releases the absorbed energy by: • vibration and dissipated heat • emission of a photon with a higher wavelength ( = less energetic)
FITC FITC FITC FITC FITC FITC FITC FITC FITC FITC Fluorescence intensity Number of Events 101 102 103 104 Relative fluorescence intensity
Parts of a flow cytometer • Fluidics • Provide a constant stream of sheath • Transport the sample to the interrogation point • Arrange and focus the cells to the laser intercept • Optics • Focus the excitation light • Collect the emitted light • Electronics • Convert the optical signals into electronic signals • Send the signals to the analysis computer • Computer • Display data graphically • Control instrument settings
What a flowcytometer is Very basically, a flow cytometer is an automated fluorescence microscope (in fact, that is how the first prototype instruments looked like). Like a microscope, some adjustments have to be made to optimally illuminate and collect the light.
The basic microscope In a standard microscope, the operator uses the XY-stage to screen the sample and detect cells of interest.
The automated Microscope Detector & Counter This primitive diagram shows the principle: Cells are passing the microscope objective, and an electronic circuit decides whether the cells is fluorescent or not. This is how a flow cytometer works! Waste Sample
Basic fluidics of the FACSAria Fluidics Cart Plenum Cuvette Pressure Sheath Sample tube Waste
Hydrodynamic focussing in the cuvette Sample Sample Sheath Sheath Sample pressure low, small core stream. Good for DNA analysis High sample pressure, broader core stream. Bad for DNA analysis 1
Summary • Pressure (= Sheath Pressure) drives the sheath buffer through the cuvette, and the higher pressure in the sample tube(= Sample Differential) delivers the sample to the cuvette. • In the cuvette the principle of hydrodynamic focussing arranges the cells like pearls on a string before they arrive at the laser interception point for analysis • Hydrodynamic focussing cannot separate cell aggregates! Flow cytrometry is a technique that requires single cell suspensions
Basic optics • Somehow the light from the laser(s) must be directed to the cuvette to illuminate the cells. • At the same time, the emitted light must be collected to analyse the signals from the cells. • The alignment of the system is performed during installation.
Basic optics A system of prisms and lenses directs the laser light to the interrogation point in the cuvette
Basic Optics The emitted light induced from each laser is focussed onto separate glass fibers.
Optical filters LongpassShortpass Bandpass 460 500 540 460 500 540 460 500 540 LP 500 SP 500 BP500/80
Octagon Detection System PerCP-Cy5.5 FITC 695/40 655 LP SSC PE PE-Cy7
Summary • Excitation light is steered with prisms and lenses to the interception point • Emitted light is collected using lenses and is split up with dichroic mirrors and filters
Tasks for the electronical system • Convert the optical signals into electonic signals (voltage pulses) • Digitise the data • Analyse Height (H), Width (W) and Area (A) of the pulse • Send the data to the analysis computer
t 1. 2. 3. Laser Voltage t Laser Voltage t Laser How a voltage pulse from the PMT is generated Voltage
Height, Area, and Width Pulse area(A) Pulse Height (H) Voltage 0 40 Time (µs) Pulse Width (W)
Threshold The threshold defines the minimal signal intensity which has to be surpassed on a certain channel. All signals with a lower intensity are not displayed and not recorded for later analysis.
Summary • During passing the laser voltage pulses are generated at the PMT • Amplifiers enhance the signals • The electronics digitizes the pulse using 10MHz sampling • Only signals passing the desired threshold(s) are analysed and recorded • The data are finally passed to the analysis computer connected to the cytometer
Instrument settings • the exact values for PMT voltages and thresholds are depending on the applications (type of cells, staining methods) and the specific instrument. • Displaying the data in a linear fashion or using the logarithmic form is also depending on the application.
Workstation • The connected workstation is designed for instrument control, data acquisition, -storage and -analysis. • OS is Windows2000 Professional running on a IBM-compatible computer platform. • Software • DiVa application: Instrument connectivity, Data-acquisition and analysis system • DiVa Data Manager: Backup and Restore the database.
Data saving All data are saved directly into a special database. Every plot is connected with its corresponding datafile. All tubes carry a copy of the instrument setting that was active during acquisition. Due to this, there are no special save commands in the software. Every action is recorded in the database. When you quit and re-start the software, it will open the last experiment exactly at the position you left it.
Visualization of data 1) Histograms - single parameter, intensity plotted as frequency distribution
30 60 638 840 100 160 245 85 300 650 160 720 1000 800 600 400 200 0 Visualization of data Listmode file 2) Dotplot - two parameter are plotted on X and Y FSC SSC FL1 FL2 Event 1 Event 2 Event 3 840 FL2-H 85 0 400 600 800 1000 200 FL1-H 245 638
Enough theory of flow! Let`s have a look at an example from real life
Example: Determine the percentage of CD3, CD4, and CD8 populations from whole blood • Material • Mouse splenocytes • Method • Three-colour immunofluorescence Preparation • Staining of freshly isolated splenocytes Stainings • Isotype controls • Single-colour stainings for CD3-FITC, CD3-PE, CD3-PerCP und CD3-APC to determine suitable instrument settings
Proper adjustment of FSC and SSC voltage • FSC und SSCare optimally adjusted when the population of interest (i.e. Lymphocytes) can be resolved from all other populations • The threshold on FSCis adjusted so that most of the debris is excluded from the data acquisition.
Parameters (I) • FSCand SSCn are depending on cell type and cell state (activated, resting)n depend on the preparation method (Ficoll, LW, LNW, fixation method etc.)nare normally used to define the population of interest for further analysis
Parameters • Fluorescence channels (FL1, FL2, FL3, FLX)n depending on the specific staining (conjugate) antibodies, propidium iodide for DNA-labelling, etc.)nmost of the time fluorescence serves as marker for the statistical analysis
Defining the population of interest(often just named „gating“)
About „Gating“ • selectively analyse defined cell populations • Gates can be set manually or automatically by software • multidimensional gating with hierarchical gates • too narrow gates may lead to the loss of cell populations • too wide gates enhance the number of unwanted cells • during analysis of the desired cell population the cells in the gate are considered to be the 100%
Adjusting the fluorescence settings • A) Adjusting PMT voltages • Sample: Isotype control • The observed fluorescence is considere to be unspecific background fluorescence, • Setup is done „gated“ on the lymphocyte population • Try to put the background into the first decade (only a rule of thumb!) B) Defining quadrants Traditionally, a „Quadrant“ is set to define the possible four populations in two-colour experiment. Later we will see that quadrants are not the appropriate way for multicolour analyses.
Q2 Q1 FITC + PE PE Q3 Q4 FITC negative Theory of quadrant analysis FL2-H FL1-H
FL1 FL2 530/30 585/42 Relative Intensität 500nm 550nm 600nm 650nm 700nm Wellenlänge ( n m ) Real life:FITC-fluorescence overspill
FL1 FL2 585/42 530/30 FITC Compensation Detektor - … % Signal Relative Intensität 500nm 550nm 600nm 650nm 700nm Wellenlänge (nm)
FL1 FL2 530/30 5 8 5 / 4 2 FITC Compensation Lowering the FITC-population is achieved by... ... Subtracting a percentage of FITC-intensity from the affected PE-channel ... … because 25% of the FITC-signal are actually detected in the PE channel ... Relative Intensity 500nm 550nm 600nm 650nm 700nm Wavelength (nm)
FL2 FL1 FL3 größer 650 585/42 530/30 Relative Intensity 500nm 600nm 650nm 700nm 550nm Wavelength (nm) PE-fluorescence overspill
Automatic Multicolour Compensation • Multicolour compensation with more than three colours can become very time-consuming because each channel has to be compensated against each other. • Automatic compensation offers the possibility to run single-color controls and let the software calculate all overspills. • Mathematical calculation results in the correct spillover values for all channels. However, to the user the visual data may look undercompensated. This will be discussed in detail during the training course.
Summary What we have seen: • the emission spectra of common fluorochromes (FITC, PE) • the spectral overlap of fluorochromes into neighbouring channels depending on the emission spectra and filtersets • how spectral overlap can lead to misinterpretation of multicolour stainings • How compensation can correct the spectral overlap of fluorochromes