Nonlinear Pharmacokinetics: A Comprehensive Overview
330 likes | 628 Vues
Learn about nonlinear pharmacokinetics and how drug parameters change with varying doses. Explore the impact on absorption, distribution, and metabolism processes.

Nonlinear Pharmacokinetics: A Comprehensive Overview
E N D
Presentation Transcript
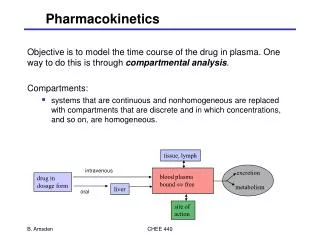
Nonlinear pharmacokinetics Dr Mohammad Issa Saleh
Introduction: Linear • Pharmacokinetic parameters, such as elimination half life (t1/2), the elimination rate constant (K), the apparent volume of distribution (V), and the systemic clearance (Cl) of most drugs are not expected to change when different doses are administered and/or when the drug is administered via different routes as a single dose or multiple doses • The kinetics of these drugs is described as linear, or dose-independent, pharmacokinetics and is characterized by the first-order process • The term linear simply means that plasma concentration at a given time at steady state and the area under the plasma concentration versus time curve (AUC) will both be directly proportional to the dose administered
Introduction: Nonlinear • For some drugs, however, the above situation may not apply • For example, when the daily dose of phenytoin is increased by 50% in a patient from 300 mg to 450 mg, the average steady-state plasma concentration, (Cp)ss, may increase by as much as 10-fold • This dramatic increase in the concentration (greater than directly proportional) is attributed to the nonlinear kinetics of phenytoin
Introduction: Nonlinear • For drugs that exhibit nonlinear or dose dependent kinetics, the fundamental pharmacokinetic parameters such as clearance, the apparent volume of distribution, and the elimination half life may vary depending on the administered dose • This is because one or more of the kinetic processes (absorption, distribution and/or elimination) of the drug may be occurring via a mechanism other than simple first-order kinetics • For these drugs, therefore, the relationship between the AUC or the plasma concentration at a given time at steady state and the administered dose is not linear
Introduction: Nonlinear Administration of different doses of drugs with nonlinear kinetics may not result in parallel plasma concentration versus time profiles expected for drugs with linear pharmacokinetics
Introduction: Nonlinear • Nonlinearity may arise at any one of the pharmacokinetic steps, such as absorption, distribution and/or elimination • For example, the extent of absorption of amoxicillin decreases with an increase in dose • For distribution, plasma protein binding of disopyramide is saturable at the therapeutic concentration, resulting in an increase in the volume of distribution with an increase in dose of the drug • As for nonlinearity in renal excretion, it has been shown that the antibacterial agent dicloxacillin has saturable active secretion in the kidneys, resulting in a decrease in renal clearance as dose is increased • Both phenytoin and ethanol have saturable metabolism, which means that an increase in dose results in a decrease in hepatic clearance and a more than proportional increase in AUC
Nonlinearity in metabolismCapacity-limited metabolism • Capacity-limited metabolism is also called saturable metabolism, Michaelis–Menten kinetics • Nonlinearity in metabolism, is one of the most common sources of nonlinearity
Nonlinearity in metabolismCapacity-limited metabolism • The rate of metabolism, or the rate of elimination if metabolism is the only pathway of elimination, is defined by the Michaelis–Menten equation: • where Vmax is the maximum rate (unit: amount/time) of metabolism; Km is the Michaelis–Menten constant (unit: same as the concentration [amount/volume]), and C is the drug concentration
Nonlinearity in metabolismCapacity-limited metabolism • Two cases: • Km>>C • Km<<C
Estimation of Michaelis–Menten parameters from administration of a single dose
Estimation of Michaelis–Menten parameters from administration of a single dose Terminal line (C<< Km) Observed conc
Estimation of Michaelis–Menten parameters from administration of a single IV bolus dose Drug amount in the Body (X) IV bolus administration (dose = X0) Elimination process Based on the assumption of nonlinear elimination process:
Estimation of Michaelis–Menten parameters from administration of a single IV bolus dose Derivation of observed concentration equation Divide by Vd Rearrangement Assume that
Estimation of Michaelis–Menten parameters from administration of a single IV bolus dose Integration Previous equation represent the observed conc
Estimation of Michaelis–Menten parameters from administration of a single dose Terminal line (C<< Km) Observed conc
Estimation of Michaelis–Menten parameters from administration of a single IV bolus dose Derivation of terminal concentration equation When C>>Km: Km+C ≈ C First order elimination Divide by Vd This equation represent the terminal concentration equation
Estimation of Michaelis–Menten parameters from administration of a single dose Terminal line (C<< Km) Observed conc
Estimation of Michaelis–Menten parameters from administration of a single dose
Estimation of Michaelis–Menten parameters from administration of a single IV bolus dose • Steps: • Plot log(conc)-time profile • Get the initial conc (C0) • Extrapolate the terminal line to get an initial terminal conc (C0*) • Calculate the slope of the terminal line using the log
Example 1 • The following concentration time profile was constructed after administration of 300 mg dose of drug A to an adult patient. find • Vm • Km • Vd • The dose required to produce a steady-state conc of 20 mg/L in this patient.
Example 1 • From the figure the following were calculated: C0=10 mg/L, C0*= 45 mg/L, and Slope (using the log) = -0.985
Example 1 • The dose required to produce a steady-state concentration of 20 mg/L in this patient:
Estimation of Michaelis–Menten parameters from two steady-state drug concentrations arising from two dosing rates • At steady state: Input rate = output rate Dosing rate = Elimination rate R is the input rate that is described as:
Estimation of Michaelis–Menten parameters from two steady-state drug concentrations arising from two dosing rates • Two dosing rates resulted in the following steady state conc: • Estimate Vmax and Km
Estimation of Michaelis–Menten parameters from two steady-state drug concentrations arising from two dosing rates Two equations with two unknowns
Example 2 • RM is a 32 year old, 80kg male who is being seen in the Neurology Clinic. Prior to his last visit he had been taking 300mg of Phenytoin daily; however, because his seizures were poorly controlled and because his plasma concentration was only 8mg/L, his dose was increased to 350mg daily. Now he complains of minor CNS side effects and his reported plasma Phenytoin concentration is 20mg/L. Renal and hepatic function are normal. Assume that both of the reported plasma concentrations represent steady state and that the patient has compiled with the prescribed dosing regimens. Calculate RM’s apparent Vm and Km and a new daily dose of Phenytoin that will result in a steady state level of about 15mg/L.
Example 2 Eqn (1)- Eqn(2): Eqn (1):
Example 2 • Calculate RM’s a new daily dose of Phenytoin that will result in a steady state level of about 15mg/L