Agent-Based Modeling of Supply Chains: Exploring Scenarios and Economic Impacts
300 likes | 319 Vues
This study investigates the use of agent-based models to analyze supply chains and explore different scenarios and their economic impacts. It proposes using a model to estimate the real opportunity cost for regional GDP and spatialize the model with representative agents from different micro-regions. The study also suggests working with evolutionary models to maximize results through agent learning.

Agent-Based Modeling of Supply Chains: Exploring Scenarios and Economic Impacts
E N D
Presentation Transcript
Supply Chains and Agent-Based Models:First Steps Pedro Ribeiro de Andrade DSA/CCST/INPE São José dos Campos, 2010
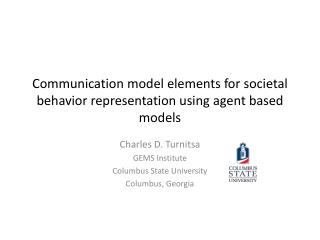
Supply Chains Source: http://www.researchintouse.com/nrk/RIUinfo/valuechain/valuechain.htm
Beer Game Objective: keep the stock close to zero • Positive stock is better than negative (half cost, chain effects) • Transportation time • Random demand How much to order given the current situation? Source: http://www.beergame.lim.ethz.ch/
ABM and Economic Chains • Do not work with real world data • Study only synchronization and forecasting • Focus on behaviour and learning Source: http://www.beergame.lim.ethz.ch/
Economy: Input-Output Matrixes Source: (Ichihara, Guilhoto, Imori, 2008)
Input-Output Matrix: One Example Economic Structure, Southeast Pará in 2004 (R$10^6) Source: (Costa, 2008)
Scenarios Source: (Costa, 2008)
Inverse of Leontief Matrix (I – A)-1 Projections of the scenarios are analitically computed over the inverse matrix. Source: (Costa, 2008)
Results of theScenarios • Remuneration • Profit • Employment • Emissions Source: (Costa, 2008)
Proposal • ReproduceChiquito’smodelusinganagent-based approach andinvestigatethesamescenarios. Tentar estimar o verdadeiro custo de oportunidade para o PIB regional. • Espacializar o modelo, com agentes representativos das sete micro-regiões. Colocar apenas os produtores iniciais da cadeia no espaço, os outros seriam onipresentes. • Trabalhar com modelos evolutivos, no qual exista um aprendizado dos agentes entre execuções do modelo, para tentar maximizar os resultados.
Input-Output Matrix Economic Structure of Southeast Pará in 2004 (R$10^6)
Model Components Agents Agents Connections Agents’ Properties Ignored
Connections Agents Agents Connections Agents’ Properties Ignored Weights are normalized to one.
Reactive Agents 0.2 0.5 B A 0.3 C • “A” received 1000: • Costs: 400 • Send 80 to “A”, 200 to “B”, 120 to “C” • Taxes: 100 • Profit: 200 • Salaries: 300 • Jobs: 1
Behaviour – Dumb Agent agent.execute = function(ag) ag:Message{receiver = government, content = "money", value = ag.received * ag.taxes} ForEachNeighbor(ag, function(neigh, weigh) ag:Message{receiver = neigh, content = "money", value = ag.received * ag.costs * weigh} end) ag.received = 0 end agent.OnMessage = function(ag, message) ifmessage.content == "money"then ag.received = ag.received + message.value end end
Demand Option 2 – Local is Endogenous Endogenous Exogenous
Demand Option 3 – Local is Mixed Endogenous Exogenous
Local Demand • Exogenous: All the demand comes from the two columns of local demand. • Endogenous: Salaries goes to the families’ expenses. Part of the profits also go to the families’ expenses (28.18%) and part to investments (11.14%). • Mixed: Only salaries go the the families’ expenses. The rest is considered exogenous (public workers, social programs, retirements).
Simulations • Generate the initial (exogenous) demand • The model runs until there is no more endogenous demand (i.e. demand <= $0.01)
Results – Four Scenarios (Differences) Scenario 1 Scenario 2 Scenario 3 Scenario 4
Future “Explode” the agents into societies, scaling down to the micro level
Future Connect them to the land use (productive) system. Good way to couple top-down and bottom-up
Future Use the new census data to generate a new economic chain and study the relations between the economic changes (of the chain) and the land use changes.
Supply Chains and Agent-Based Models:First Steps Pedro Ribeiro de Andrade DSA/CCST/INPE São José dos Campos, 2010