Correlations in Data Analysis
Explore different types of correlation analyses, such as linear and nonlinear relationships, for nominal, interval, and ratio data. Learn about Pearson’s r and Spearman's rho, as well as interpretation of correlation values. Discover how to identify significant correlations and limitations in data analysis.

Correlations in Data Analysis
E N D
Presentation Transcript
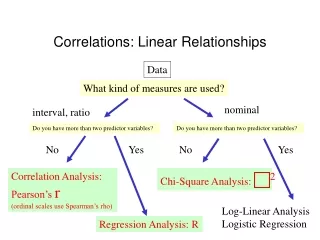
Correlations: Linear Relationships Data What kind of measures are used? nominal interval, ratio Do you have more than two predictor variables? Do you have more than two predictor variables? No Yes No Yes Correlation Analysis: Pearson’s r (ordinal scales use Spearman’s rho) Chi-Square Analysis: 2 Log-Linear Analysis Logistic Regression Regression Analysis: R
Interpretation of r -1< r <1 0 < r < 1 -1 < r < 0 If the relationship between X and Y are positive: If the relationship between X and Y are negative: If p-value associated with the r is < .05 The variable X and Y are significantly correlated with each other. Positively: 0 < r < 1, Negatively -1 < r < 0 If p-value associated with the r is >. 05 There is NO significant correlation between X and Y, even if the value of r is positive or negative.
Scatterplots as visual representations of correlations College GPA Scatterplot 4.0 3.0 2.0 1.0 A graph in which the x axis indicates the scores on the predictor variable and the y axis represents the scores on the outcome variable. A point is plotted for each individual at the intersection of their scores. Regression Line A line in which the squared distances of the points from the line are minimized. 1.0 2.0 3.0 4.0 High School GPA
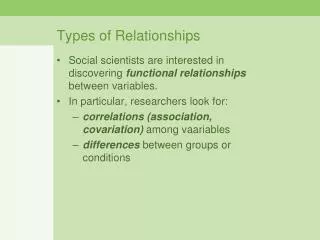
Linear Relationships and Nonlinear Relationships Y Y X Positive Linear Negative Linear X Y Y Y X X Curvilinear Curvilinear X Independent
Limitation 1. Cases in which the correlation between X and Y that have curvilinear relationships r = 0 2. Cases in which the range of variables is restricted. Example. SAT scores and college GPA Restriction of Range 3. Cases in which the data have outliersr > |.99|
Limitations Curvilinear Restricted Range Outlier