Download
1 / 1
10 likes | 99 Vues
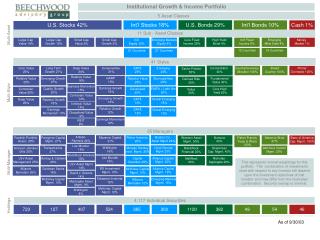
Explore a comprehensive portfolio encompassing 5 asset classes, 12 countries, and 41 styles for stable growth and income. Indulge in large cap, small cap, bonds, equities, and global diversification with top-tier managers.

E N D
Institutional Growth & Income Portfolio 5 Asset Classes U.S. Stocks 42% Int’l Stocks 18% U.S. Bonds 29% Int’l Bonds 10% Cash 1% 11 Sub - Asset Classes Multi-Asset Large Cap Value 19% Large Cap Growth 19% Small Cap Value 2% Small Cap Growth 2% Int’l Equity 12% Emerging MarketsEquity 6% Core FixedIncome 25% High Yield Bond 4% Int’l Fixed Income 6% Emerging Mkts Debt 4% Money Market 1% 12 Countries 15 Countries 21 Countries 27 Countries 41 Styles Deep Value 24% Conservative 31% EAFE 25% Emerging 24% Core Value 25% Long TermGrowth 27% Concentrator 40% Country/Currency Allocator 100% BroadCountry 100% Prime/Domestic 100% Sector Rotator 50% Relative Value 16% GARP 16% Emerging Growth 27% Burmuda/Asia 23% Relative Value 25% Relative Value 25% FundamentalValue 40% Defined Risk 30% Business Momentum 15% Earnings Growth 16% EMEA + Latin Am 20% Quality Growth 20% Developed 25% Contrarian Value 25% Core High Yield 20% Value 20% Multi-Style Contrarian Value 14% Emerging Growth 13% EAFE 13% Global Emerging 18% Deep Value 25% Relative Growth 16% Intrinsic Value14% Relative Growth12% EAFE 12% Earnings Momentum 10% Global Emerging 15% Disciplined Value 9% Earnings Momentum 12% REIT 8% 35 Managers Artisan Partners 24% Boston Co. Asset Mgmt 24% Mazama Capital 31% Fisher Invstmts. 25% Franklin Portfolio Assoc. 25% Peregrine CapitalMgmt. 27% Nomura 40% Salomon Bros. 67% Fisher FrancisTrees & Watts 100% Western AssetMgmt. 50% Banc of AmericaCap. Mgmt. 100% Lee Munder 16% Lloyd George Mgmt 23% Wellington16% Transamerica 27% Morgan StanleyInvst. Mgmt. 25% Ashmore InvstmtMgmt. 33% Aronson JohnsonOrtiz 25% ShenkmanCap. Mgmt. 40% BlackRockFinancial 30% BlackRock Advisors 15% Lee Munder16% Alliance CapitalMgmt. 20% Montag & Caldwell20% Capital Guardian 25% LSV Asset Management 25% Nicholas-Applegate 20% MetWest20% This represents normal weightings for this portfolio. The combination of investments used with respect to any investor will depend upon the investment objectives of that investor and may differ from the illustrated combination. Security overlap is minimal. Multi-Manager LSV Asset Mgmt 14% RS InvestmentMgmt. 13% Alliance CapitalMgmt. 18% Goldman Sachs16% Alliance Bernstein 25% McKinley Capital Mgmt. 13% David J. Greene14% Delaware Invstmts. 12% McKinley Capital Mgmt. 10% Emerging MarketsMgmt. 15% Alliance Bernstein 12% Martingale Asset Mgmt. 9% McKinley CapitalMgmt. 12% Wellington8% 4,117 Individual Securities Holdings 723 127 407 524 385 300 1120 382 49 54 46 As of 9/30/03