Download
1 / 15
150 likes | 239 Vues
Learn about inverse modeling, sensitivity matrices, and calibration methods for groundwater recharge issues using Excel. Get insights into PEST, UCODE, Gauss-Newton, and more.

E N D
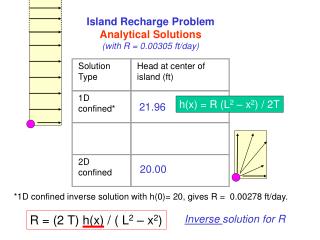
Using General Inverse Theory to Calibrate the Island Recharge Problem in EXCEL
What I hope to do with this talk… • Provide enough general theory so folks will be better prepared to tackle manuals for automated calibration programs such as PEST • Demonstrate a simple tool to help illustrate some of these ideas
Why is it called inverse modeling? • The forward model • solve for heads given R and K: A is called the sensitivity matrix (m x n) x is the parameter (or upgrade) vector (m x 1) b is the observation (or residual) vector (n x 1) m is the number of observations n is the number of parameters
Why is it called inverse modeling? • The inverse model • Solve for K and R given a set of measured heads
So what is the sensitivity matrix? • Sensitivities are the derivatives of the groundwater flow equation with respect to parameters • PEST and UCODE approximate these derivatives using finite differences • No different than how we have been approximating the groundwater flow equation • Called perturbationsensitivities
So what is the sensitivity matrix? • Both PEST and UCODE approximate the derivatives using forward and central differences • PEST provides a few more options including a best-fit or the slope of a polynomial fit to the three points calculated head p(1-derinc) p p(1+derinc)
So what is the sensitivity matrix? One column for each parameter One row for each observation
So how do we invert A? • UCODE: • Modified Gauss-Newton (small problems) • Parameter Parsimony (Arbitrary zonation???) • PEST: • Modified Gauss-Newton • SVD (medium) • LSQR! (large) • Both programs can make use of: • Damping (Marquardt parameter)
So how do we invert A? • Modified Gauss-Newton: • Can only invert square matrices • Called the normal equation; ATA is a square n x n matrix • As the number of parameters increases the likelihood of ATA being singular (not invertible) increases
So how do we invert A? • Singular-Value Decomposition (SVD): • Decomposes a matrix according to: • Finds the pseudo-inverse of any matrix (square or not) according to: • Can solve for several thousands of parameters given thousands of observations before it just takes too long to be practical
Observation and sensitivity weights • Can be used to scale observations or sensitivities so they are all within the same order of magnitude • The normal equation becomes:
Marquardt-Lambda • I am not going to get into this as I don’t fully understand it yet myself; I just know its needed for some problems to work (even 2x2 problems) • The normal equation becomes: • This is the form of the equation the EXCEL file solves for a simple 1x2 or 2x2 problem
And finally the objective function • Weighted Least-Squares: • or
EXCEL Demo • Estimate R and K given 1-head observation • Estimate R and K given 1-head and 1-flux observation • Without observation weights (Q=1) • With observation weights • Estimate R and K given 1-head observation with scaling of the sensitivity matrix