Improving Operational Efficiency: Insights from Toyota's Approach to Waste Reduction
140 likes | 269 Vues
In this analysis, we explore Taiichi Ohno's philosophy on operational efficiency as exemplified by Toyota. The focus is on minimizing non-value-added activities in the production process, utilizing flow process charts to identify bottlenecks. We delve into a case study of a Pediatric Orthopedic Clinic aiming to reduce patient wait times and improve service performance. Key questions for adopting a process view are presented, addressing the importance of understanding process boundaries, flow units, activities, and resource constraints to streamline operations.

Improving Operational Efficiency: Insights from Toyota's Approach to Waste Reduction
E N D
Presentation Transcript
MGMT 208: Operations Management Fall 2011 Class #2
Toyota’s Way What is Toyota doing now? TaiichiOhno’s answer was very simple: “All we are doing is looking at the time line from the moment the customer gives us an order to the point when we collect the cash. And we are reducing that time line by removing the non-value-added wastes.” (TaiichiOhno. Toyota Production System: Beyond Large-Scale Production. p. ix.) http://www.youtube.com/watch?v=kq4JVkkCzKY
Little’s LawExample A major manufacturer sells $300 million worth of cellular equipment per year. Average amount in accounts receivable is $45 million. What is the average elapse time from the time a customer is billed to the time payment is received? Note that in this case, the process is the manufacturer’s account receivable department and the flow unit is a dollar in accounts receivable.
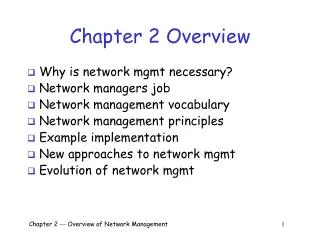
Analyzing the Job • Flow process chart • Chart used to examine the overall sequence of an operation by focusing on movements of the operator or flow of materials
Symbols for Flow-Process Chart Operation(a task or work activity) Inspection(an inspection of the product for quantity or quality) Transportation(a movement of material from one point to another) Storage(an inventory or storage of materials awaiting the next operation) Delay(a delay in the sequence of operations)
FLOW PROCESS CHART Job Requisition of petty cash ANALYST D. Kolb PAGE 1 of 2 Operation Inspection Movement Storage Delay Details of Method Requisition made by department head Put in “pick-up” basket To accounting department Account and signature verified Amount approved by treasurer Amount counted by cashier Amount recorded by bookkeeper Petty cash sealed in envelope Petty cash carried to department Petty cash checked against requisition Receipt signed Petty cash stored in safety box
Questions to ask when adopting a process view 1. What are the process boundaries: what is the input and output? 2. What is the flow unit or the unit of analysis? 3. “Attach yourself to” the flow unit and record its process steps through the process • What are the value-added and necessary activities? What are the associated processing times or work content? • Where does the flow unit wait (buffers)? What are the associated waiting times? • What are the routesa flow unit can take?What are necessary precedence relationships? (i.e., what must be done sequentially?) • Note that the first improvement step will be to delete non-value-added and unnecessary activities and buffers = waste
Questions to ask when adopting a process view (Cont.) 4. Who does the work? What are the resources for each activity? • What are all the activities a given resource performs? (cross-training , flexibility) • What are the resource constraints? What determines the flow rate? (demand or capacity) • How is quality measured? • What is the cost of each resource? 5. What information is required to perform each activity? Where does this information come from? This specifies the information flow (dashed lines) Key for Capacity Analysis
Case Study • PaediatricOrthopaedic Clinic at the Children's Hospital of Western Ontario
Introduction • As Chief of PaediatricOrthopaedic Surgery, Dr. Leitch was very concerned by the long wait times that the young patients (and their parents) were experiencing in the clinic. Long wait times tended to aggravate the already pent-up distress and concern that they were feeling. She glanced at recently collected data on service times and wondered how the process might be improved, while continuing to balance budgetary pressures to reduce costs. Moreover, any changes could not be done in isolation, as her clinic shared resources with other departments. A monthly executive meeting was fast approaching, and expectations were starting to run high that Leitch’s efforts might be able to spur improvements in other departments too.
Issues • Major: • Reducing lengthy wait times • Minor: • Improving process and service performance • Reducing variability in activity times and wait times • Identifying the interactions with patients from other departments (shared resources) • Efficiently managing both demand and human resources to address patient needs.
Average Patient Mix at the Clinic Patients - 80 New – 80 (40% of total patients) Follow-up - 48 (60% of total patients) Need X-Ray – 40.8 (85% of follow-up patients) No X-Ray required- 7.2 (15% of follow-up patients)