Download
1 / 8
80 likes | 146 Vues
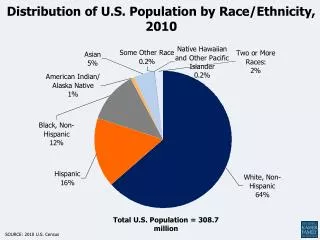
Percent of United States Population By Age Group and Ethnicity, 2000. Percent. 100. 83.6. 78.5. 78.3. 76.6. 74.2. 71.9. 80. 69. 65.2. 63.1. 62.8. 61.9. 61.1. 59.9. 58.4. 60. 41.6. 40.1. 38.9. 38.1. 37.2. 36.9. 34.8. 40. 31. 28.1. 25.8. 23.4. 21.7. 21.5. 16.4. 20.

E N D
Percent of United States Population By Age Group and Ethnicity, 2000 Percent 100 83.6 78.5 78.3 76.6 74.2 71.9 80 69 65.2 63.1 62.8 61.9 61.1 59.9 58.4 60 41.6 40.1 38.9 38.1 37.2 36.9 34.8 40 31 28.1 25.8 23.4 21.7 21.5 16.4 20 0 < 5 years 65 + years 5 to 9 years 10 to 14 years 15 to 19 years 20 to 24 years 25 to 29 years 30 to 34 years 35 to 39 years 40 to 44 years 45 to 49 years 50 to 54 years 55 to 59 years 60 to 64 years Source: Steve Murdock, Texas A&M University Anglo Non-anglo
An Aging Labor ForceAge Distribution of Labor Force 2002 and Projected 2012 Source: Employment Policy Foundation analysis of BLS/Census Current Population Survey data.
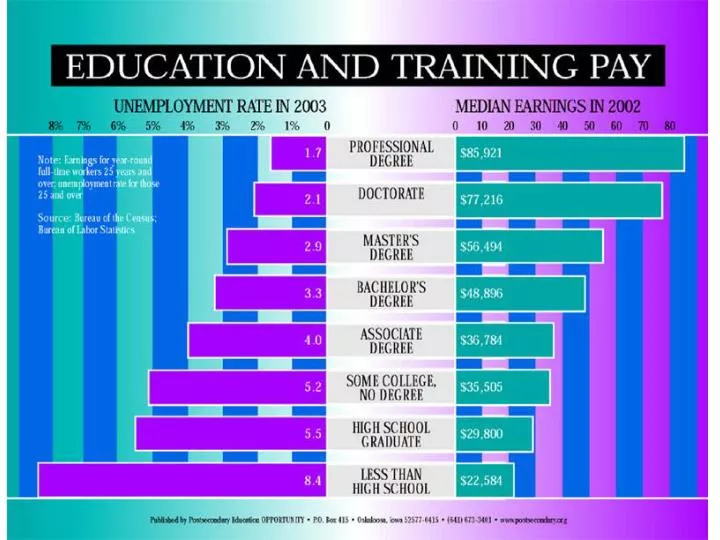
New Jobs Will Require More EducationEmployment by Education 2002 and Projected 2012 Source: Employment Policy Foundation projections based on Current Population Survey data 1992-2002.
Higher Skills Needed for Fast Growing Services than for Declining Mfg Industries Occupational Skill of Fastest Growing and Declining Industries, Virginia, 2002-2012 2.7 Average Mfg Skill 2.9 Computer/Electronic Prod. Mfg. 2.8 Chemical Mfg. Job Loss 2.6 Petro./Coal Prod. Mfg. 2.7 Paper Mfg. 2.3 Leather/Allied Prod. Mfg. 2.5 Apparel Mfg. 2.6 Textile Prod. Mills 2.6 Textile Mills 2.7 Beverage/Tobacco Prod. Mfg. 2.6 Mining 2.9 Average Serv. Skill 2.6 Food Serv./Drinking Places 2.7 Amusement, Gambling/Recreation Ind. 2.9 Social Assist. 2.9 Job Gain Nursing/Res. Care Facilities 3.1 Hospitals 3.0 Ambulatory Health Care Serv. 3.1 Ed. Serv. 2.9 Admin./Support Serv. 3.0 Profess., Scientific, and Tech. Serv. 3.1 Internet Serv. /Data Process. Serv. 2.0 2.2 2.4 2.6 2.8 3.0 3.2 Skill Measure of Occupations in Industries Source: JobsEQ™
Best Performing State US Average Virginia 100 84 80 74 67 58 60 42 39 38.8 40 38 32.1 30 28 26.7 26 20 18 20 0 Graduate from Enter College Enrolled Graduate within 25 to 44 with a High School Sophomore Year 150% Bachelor's Student Pipeline: Of 100 9th Graders – the number who graduate from HS within four years, go directly to college, return their second year, and graduate within 150% of program time
U.S. Department of Education research indicates the college attendance rate is significantly influenced by socio-economic status, despite the level of academic achievement. SES Quartile By Achievement Test and Socioeconomic Status Quartile Lowest Highest Highest 78% 97% Achievement Quartile Lowest 36% 77% Postsecondary Enrollment Within Two Years of High School Graduation Source: Access Denied, Department of Education, February 2001
The “State Ask” • Student access, including underserved students • Affordability, regardless of family income • Broad range of academic programs • High academic standards • Articulation agreements with VCCS • Economic development • Sponsored research • K-12 education and student achievement • Financial and administrative standards