Download
1 / 29
290 likes | 444 Vues
PAPA Project: Mortality Time Series Bangkok, Hong Kong, Shanghai, Wuhan. Presented at BAQ 2006 Yogyakarta December 13-15, 2006. PAPA group – First Wave. Bangkok N Vichit-Vadakan, N Vajanapoom, B Ostro Hong Kong

E N D
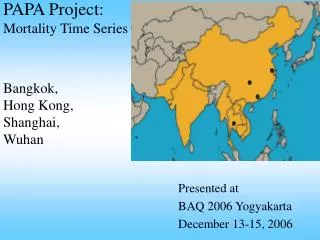
PAPA Project:Mortality Time Series Bangkok, Hong Kong, Shanghai, Wuhan Presented at BAQ 2006 Yogyakarta December 13-15, 2006
PAPA group – First Wave Bangkok N Vichit-Vadakan, N Vajanapoom, B Ostro Hong Kong CM Wong, JSM Peiris, TQ Thach, PYK Chau, KP Chan, RY Chung, GN Thomas, TH Lam, TW Wong, and AJ Hedley Shanghai HD Kan, BH Chen,NQ Zhao, GX Song, GH Chen, LL Jiang, and YH Zhang Wuhan Z Qian, Q He, HM Lin, L Kong, D Zhou, D Liao, W Liu, CM Bentley, J Dan, B Wang, N Yang, S Xu, J Gong, H Wei, H Sun, and Q Zudian
PAPA – First Wave WHY ? Shanghai Wuhan Hong Kong Bangkok
Selection Criteria • Data Availability and Accessibility • Research capacity and experience • Investigators’ interest
138 Air Pollution Health Effects Studies HEI Special Report 15, 2004 PAPA ProjectMulti-City Study One major goal Compare results across the cities • Factors similarities or differences • Air pollution • Climate • Population characteristics • Economic structure • Health status and health care system • Etc…
PAPA Project: Multi-City StudyApproach Similar Research Methodology • Common research protocol • Existing literature • Inputs from experts • Participatory process • Data Collection • Mortality Data • Air pollution Data • Data Analysis
Common Protocol for Pollutant Measurement • General monitoring stations • Days with data >75% of hourly measurements • Daily mean: 24 hours for NO2, SO2 and PM10; 8 hours for O3 • Stations with data > 75% daily data for study period • The same stations for the whole period • Simple average without filling in missing data was used to compute the daily mean
Commonality Risk estimates of air pollution on mortality Combined City specific Specifics Bangkok Effects of economic recession in 1997 Hong Kong Effects of influenza Wuhan Effects of temperature Commonality Vs. Specifics
Plots of daily death counts for all natural causes Clearer seasonal cycle when we go further north.
PM10 NO2 g/m3 g/m3 O3 SO2 g/m3 g/m3
Establishment of core model • Poisson regression in a Generalized Additive Model (GAM) where E(y):Expected daily mortality counts X: air pollutant concentration Z: dummy variables γ: covariates i: regression coefficients df: 3 df for temperature and humidity; 4-6 df per year for time subject to city conditions s: smoothers based on natural spline method
Criteria/methods for adequte model • When |PACF| < 0.1 for the lag 1-2 days, the core model is regarded as adequate. • The following 3 methods were established to meet these criteria: • Localized smoothing (WH) • Inclusion of epidemic variables (defined by weekly respiratory mortality >90th percentile) (HK) • Introduction of auto-regression terms (HK, SH)
Cross validation of results • To ensure the results free from technical errors • Pair up cities (HK-WH, BK-SH) • Provide data in a standardized format with core models • Replicate estimates of PM10 and NO2 on • all causes • cardiovascular mortality • Preliminary results showed no differences between original and replicated estimates
BK HK SH WH Most significant lag Comparison of results across cities All natural causes all ages PM10 Excess risk per10g/m3 (%) BK had the biggest but less precise ER than the others
BK HK SH WH Most significant lag NO2 Excess risk per 10g/m3 (%) All cities had similar ER and lag structure
BK HK SH WH Most significant lag SO2 Excess risk per 10g/m3 (%) Similar ERs across cities, but less precise in BK and non-significant in WH.
BK HK SH WH Most significant lag O3 Excess risk per 10g/m3 (%) Similar ERs and 95% CIs among all cities, though not significant for HK and WH.
Co-pollutant model BK HK SH WH PM10 S – single effect C1 – adjust NO2 C2 – adjust SO2 C3 – adjust O3 Excess risk per 10g/m3 (%) After adjusting for NO2, ER for PM10 attenuated and became non-significant in all the Chinese cities
Meta analysis * The p-value for test of homogeneity <0.001
Meta analysis • *The p-value for test of homogeneity <0.05; • ** The p-value for test of homogeneity <0.001.
Sensitivity analysis All natural causes, Lag day 0 ER changed >20% in blue colour.
In general the estimates were robust to the sensitivity analysis • However, some estimates were sensitive to exclusion of higher PM10 concentrations and the traffic related stations • The estimates were different during warm season, but were quite robust using different methods in dealing with missing data and in data analysis (data not shown)
Effects for NO2 higher but PM10 slightly lower than European estimates; while SO2 and O3 were similar. Comparison with other coordinated study All natural causes – ER% per 10mg/m3 with random effect
Discussion • There are similarities as well as discrepancies in effect estimates within PAPA cities with varying air pollution levels, and socio-economic and environmental conditions • The combined estimates from the 4 PAPA cities are largely consistent with those from other multi-city studies, except from NO2 which is three times as high as that from the European studies • Further sensitivity analysis may help to validate the results and throw light on the sources of variations • Larger number of cities is need to consolidate the results
Way forward - Joining with the second wave India cities To form Bigger PAPA.