Download
1 / 56
570 likes | 726 Vues
This article explores the implementation of integrated ecosystem management within the Eastern Scotian Shelf Integrated Management (ESSIM) area, highlighting the ongoing dialogue and interaction between fisheries management and ecosystem science since its inception in 1998. It discusses the governance framework, the development of ecosystem objectives, and the prioritization of ecological issues based on stakeholder input. The challenges of balancing scientific precision with practical management needs are emphasized, alongside the evolution of national policies affecting the Gulf of Maine Area (GOMA).

E N D
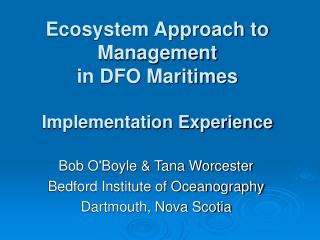
Ecosystem Approach to Managementin DFO MaritimesImplementation Experience Bob O'Boyle & Tana Worcester Bedford Institute of Oceanography Dartmouth, Nova Scotia
Background • Two 'Laboratories' • Eastern Scotian Shelf (ESSIM) • One of first DFO pilots (started in 1998) • Governance (Oceans lead) • Ecosystem objectives (Science lead) • Gulf of Maine Area (GOMA) • Emerging since first interaction with US in 2004 • Challenges • Tension between management pragmatism & scientific elegance • Evolving national policy & guidelines
Current Eastern Scotian Shelf Integrated Management Planning Area Ongoing Dialogue on Western Boundary & Inshore / Offshore Boundary
Planning Hierarchy Overarching Conceptual Objectives National Ecosystem Objectives Planning Area Conceptual Objectives ESSIM Area Ecosystem Objectives Planning Area Operational Objectives Monitor Ecosystem States Control Cumulative Impacts of Sectors Sector Operational Objectives Control Impacts of Sectors Sub - Sector Operational Objectives Control Impacts of Sub-Sector
Identification of Issues & Ecosystem Components in ESSIM Area • Determined IM Area specific Issues • Key issues from Science & stakeholder perspective • Working Groups & Workshops • Product was layman’s understanding of Issues at IM Area Level • Organized by national ecosystem objective
NationalEcosystem Objectives(2001 Workshop) Draft ESS Ecosystem Objectives developed consistent with this framework
Draft Ecosystem Objectives for ESSIM Area Driven by issues specific to ESSIM Area
ESSIM Area Ecosystem Objectives • Ecosystem Objectives released in Fall 2005 in draft ESSIM Plan • Still high level • Further refinement upon determination of: • Ecological & Biological Significant Areas (EBSAs) • Ecological & Biological Significant Species • Degraded Areas • Depleted Species • Need for formal prioritization process • Quantitative vs Qualitative Risk Analysis • Risk of NOT achieving overarching objective
IM Area Operational Objectives • ESSIM Science WG developed workplan by ecosystem objective to define operational objectives • Some completed (e.g. Primary Productivity, Sediment, cod, plaice, halibut) • Project put on hold to await refinement of ecosystem objectives • GOMA Science WG developed draft operational objectives based upon early ESSIM work • Focus on monitoring • Specific to fisheries • Regional DFO Workshop (October 2005) • Engage & educate all sectors on integrated management • Opportunity to compare / contrast ESSIM & GOMA approaches • Developed generic working set of IM area operational objectives
Conservation of Benthic Communities • Oceans requested Science advice on this objective in 2000 • Three phase process • June 2001: Benthic Classification Systems • July 2005: Classification of Scotian Shelf Benthic Community • 2006/07: Characterization on impacts, indicators & reference points • Since initiation of process, complementary related initiatives (e.g. EBSA) underway
Scope for Growth Based on Southwood Model High Productivity (Benign) Low Productivity (Adverse) Highest Risk to Impact Stable Lowest Risk to Impact Disturbance e z Wave height/period i t Disturbed s n h n e t i r p r a u r e G D C Food Availability Water temperature Variability in temperature Oxygen Saturation Stratification
Areas of Potentially Higher Risk High Risk Areas
Sector Operational Objectives • Decided to engage fishing sector on EBM • Presented generic IM area operational objectives to Scotia-Fundy Industry Roundtable (Jan 2006) • Fishing industry agreement to evaluate Fisheries Management Plans (FMPs) against objectives
Evaluations Completed Maritimes Fisheries Management Plans
Preliminary Evaluation ofGeorges Bank FMPs • Blue: high relevance that currently receive attention • Red: high relevance & require attention • Others: of low relevance
Monitoring & Reporting • Regulatory • Performance indicators • Ecosystem • Contextual indicators • Study of ecosystem processes e.g. causality • Changes in reference points e.g. regimes shifts • Suite of 60+ indicators reported in 2003 Ecosystem Status Report • Now working on set for Gulf of Maine Area • More formally linked to ecosystem objectives
Grey seals, pelagic fish abundance, invertebrate landings, fish species richness, phytoplankton Bottom temp., exploitation, groundfish biomass & landings, growth-CHP, avg. fish weight, copepods 1970 1975 1980 1985 1990 1995 2000
Why these Changes? 1) Top - Down Control?
Why these Changes? 2) Increased Stratification? Would favour proliferation of pelagic food web & limit flux of nutrients to benthos
Why these Changes? 3) Cooling? Cooling & increased advection associated with increases in cold water species
4TVW Haddock and Environment 0C Tons 0C Management Reference Points would be modified based upon environment Implications for inclusion of 'Regime Shifts' in management actions
Future ESR Proposal Suite of Operational Objectives At Planning Area Level Would define Ecosystem Health Colour indicates Performance Of Operational Objective Green: Good Yellow: Caution Red: Poor
Lessons for Workshop • Develop common understanding of high level objectives • Compare regional sets of objectives & associated issues specific to planning area • Stakeholder workshop? • Planning area level • Contextual indicators • Ecosystem processes • Relevant to RP / RDs • Fishery level • Regulatory / tactical indicators & Reference points / Directions • Management action? • PICES Report • Keep general but move towards objectives structure • Maintain array of indicators Time trends by functional group & area
Final Thoughts • Need Stakeholder buy-in to IM • IM provides framework that links policies & initiatives • Need Manager buy-in to IM • Currently putting FMPs into framework to show what exists now & what gaps exist • Need Science buy-in to IM • Currently reviewing science work plans in relation to ecosystem objectives
Outline • Background • Management Area Boundaries • Planning Hierarchy • Monitoring & Reporting
Management Area for EAM • Ecological Features across wide range of spatial scales • Many existing administrative areas for fisheries & other ocean uses • Challenge • Need to find consensus amongst diverse perspectives
Scientist Perspective 2004 Ecoregions Workshop ESS GOMA
Fishery Manager Perspective4VsW Cod 4VsW Cod
Proposed Solution Select management areas based on established governance structures Use nested approach Ecological features larger than IM area require coordinated management actions amongst relevant contiguous areas Small ecological features require fine spatial resolution of management actions within IM area
Two Types of Objectives • Conceptual Objective or Goal • Interpret legislative mandate to be understandable to broad audience • E.g. Restore Coral Community Biodiversity to pre-1980 levels • Operational Objective or Strategy • Link between Conceptual Objective & Management Action • Specific enough to be clear to all • Refers to indicator (e.g., biomass) & reference point (e.g., 50,000 t) • E.g. Limit Area (sq Km) disturbed of Coral Community to 5000 sq km
Strategic Operational 1. Objective Decision Rules 1.1 Sub-Objective Verb + If I 1 is RED reduce exploitation · º 1.1.1 Operational Objective Indicator 1 If I 1 is YELLOW do not increase · + If I 1 is GREEN increase slightly · · Reference point · · · · · · · Verb · + º 2.1.2 Operational Objective Indicator 2 + Reference point Policy Domain Unpacking AHA! Healthy fish stocks for the benefit of Canadians Rebuild or maintain biomass at optimum levels Restore abundance to levels comparable to the 1950-60’s Management Domain
Steps to Operationalize ESSIM Plan • Identify conservation issues & impacted ecosystem components • Organize issues / components using national objectives as guide & state as ESSIM Ecosystem Objectives • Identify Ocean Sectors implicated in implementation of ESSIM Ecosystem Objective • Define Operational Objectives for ESSIM Area • Define Operational Objectives for each Ocean Sector
Adversity, limiting factors model Chla Stratification Temperature Seasonal var Interannual var
Sectors Implicated in Implementation Based upon Qualitative Human Impact Threats Analysis
Other Sectors • Aquaculture • Decision rules for Sulphides developed • Working on additional indicators e.g. oxygen • Oil & Gas • Code of Practice for seismic noise • Discharge guidelines • Transport • Ballast water regulations (invasives) Consolidation under one framework required to address cumulative effects
Habitat Classification Kostylev 2005
Contextual IndicatorsStudy of ecosystem processes • Physical & Chemical • Salinity, temperature, stratification • Sea level, currents • NAO index, wind stress • Nutrients • Biological • Phyto & zoo plankton • Finfish & small pelagic community condition • Pelagic / demersal Biomass ratio
Index of Ecosystem Change PCA 1 -1.0 -0.5 0.0 0.5 1.0 1.5 1970 1975 1980 1985 1990 1995 2000 Demersal ---------------------------- Pelagic/invertebrate system Clear shift in ecosystem state based on 60+ indicators