Download
1 / 14
201 likes | 1.08k Vues
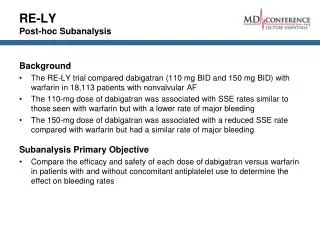
POST HOC COMPARISONS. A significant F in ANOVA tells you only that there is a difference among the groups, not which groups are different. Post hoc tests can be done to make specific comparisons. Post hocs also control experimentwise alpha level. Fisher’s PLSD.

E N D
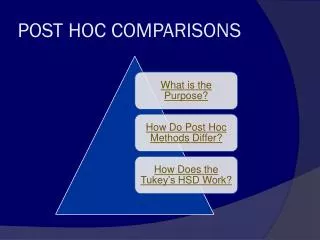
POST HOC COMPARISONS • A significant F in ANOVA tells you only that there is a difference among the groups, not which groups are different. • Post hoc tests can be done to make specific comparisons. • Post hocs also control experimentwise alpha level.
Fisher’s PLSD • Protected Least Significant Difference • F-test in ANOVA must be significant • Pairwise comparisons only • pairwise - compares two groups • Less conservative post hoc
Tukey’s HSD • Honestly Significant Difference • Each group must have same N • Pairwise comparisons only • Critical value increases with number of groups • Medium conservative post hoc
Scheffe • Pairwise or non-pairwise comparisons • High critical value in exchange for allowing any comparison • Very conservative post hoc
Examples of Non-Pairwise Comparisons: (Therapy A & Therapy B) vs. Placebo (No Noise & Low Noise) vs. High Noise
Computation of Tukey’s HSD Example: An ANOVA was done comparing spelling performance in three noise conditions. Determine which conditions were significantly different from each other. (Data and ANOVA table follow)
No noise Low noise High noise 15 15 12 17 19 10 18 14 10 14 12 12 x=16 x=15 x=11 overall x = 14
Source SS df MS F p Between 56 2 28.00 6.31 <.05 Within 40 9 4.44 Total 96 11
STEP 1: Look up q. k = 3 groups df error = df Within = 9 q from table = 3.95
STEP 3: Compute mean differences. No noise vs. Low noise: 16-15=1 No noise vs. High noise: 16-11= 5 Low noise vs. High noise: 15-11 = 4
STEP 4: Compare differences to HSD. If the difference is equal to or greater than the HSD, it is significant. No noise vs. Low noise: not sig. No noise vs. High noise: significant Low noise vs. High noise: not sig.
APA Format Post hoc comparisons were done using Tukey’s HSD. The difference between the no noise and high noise conditions was significant. The difference between the no noise and low noise condition was not significant, and the difference between the low noise and high noise conditions was not significant.