Download
1 / 1
10 likes | 110 Vues
Explore novel roles of the PXR receptor through a bioinformatic study using berberine as an agonist. Learn about gene interactions and potential pathways. Investigate impact on cell viability and gene expression.

E N D
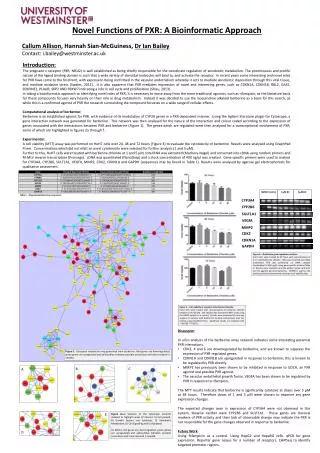
Novel Functions of PXR: A Bioinformatic Approach Callum Allison, Hannah Sian-McGuiness, Dr Ian Bailey Contact: i.bailey@westminster.ac.uk Introduction: The pregnane x receptor (PXR, NR1I2) is well established as being chiefly responsible for the coordinate regulation of xenobiotic metabolism. The promiscuous and prolific nature of the ligand binding domain is such that a wide variety of steroidal molecules will bind to, and activate the receptor. In recent years some interesting and novel roles for PXR have come to the forefront, with expression being confirmed in the vascular endothelium whereby it acts to mediate xenobiotic disposition through this vital tissue, and mediate oxidative stress (Swales, 2012). It is also apparent that PXR mediates expression of novel and interesting genes, such as Cdkn1A, Cdkn1b, Rbl2, Gas1, Serpine1, Plaur, Skp2 and Fbxw7 indicating a role in cell cycle and proliferation (Shizu, 2013). In taking a bioinformatic approach to identifying novel roles of PXR, it is necessary to move away from the more traditional agonists, such as rifampicin, as the literature basis for these compounds focuses very heavily on their role in drug metabolism. Instead it was decided to use the isoquinolinealkaloid berberineas a basis for this search, as while this is a confirmed agonist of PXR the research surrounding the compound focusses on a wide range of cellular effects. Computational analysis of berberine: Berberine is an established agonist for PXR, with evidence of its modulation of CYP3A genes in a PXR dependent manner. Using the Agilent literature plugin for Cytoscape, a gene interaction network was generated for berberine. This network was then analysed for the nature of the interaction and colour coded according to the expression of genes associated with the interactions between PXR and berberine (Figure 1). The genes which are regulated were then analysed for a transcriptional involvement of PXR, some of which are highlighted in figures 2a through f. Experimental: A cell viability (MTT) assay was performed on HuH7 cells over 24, 48 and 72 hours (Figure 3) to evaluate the cytotoxicity of berberine. Results were analysed using GraphPad Prism. Concentrations which did not elicit an overt cytotoxicity were selected for further analysis (1 and 5 µM). Further to this, HuH7 cells were treated with berberine chloride at 1 and 5 µM, total RNA was extracted (Machery-Nagel) and converted into cDNA using random primers and M-MLV reverse transcriptase (Promega). cDNA was quantitated (NanoDrop) and a stock concentration of 400 ng/µl was created. Gene specific primers were used to analyse for Cyp3A4, Cyp2B6, Sult1A1, VegfA, Mmp2, Cdk2, Cdkn1A and GAPDH (sequences may be found in Table 1). Results were analysed by agarose gel electrophoresis for qualitative assessment. Table 1 – Oligonucleotide primer sequences. Figure 4 – Qualitative gene expression analysis: Huh7 cells were treated for 48 hours with concentrations of 1 or 5 µM berberine chloride. RNA was extracted and cDNA synthesised. PCR was performed on cDNA samples standardised to 400 ng/µl, using gene specific primers (Table 1) Results were analysed using the GelRed nucleic acid stain and 1% agarose gel electrophoresis. GAPDH is used as the loading control to demonstrate consistency of amplification. Figure 3– Cell viability in response to berberine chloride: Huh7 cells were treated with concentrations of berberine chloride between 0 and 20 µM. Cell viability was assessed by MTT assay using the DMSO vehicle as a control. Results were processed by one way analysis of variance with Bonferroni multiple comparisons post hoc testing using GraphPad Prism, significant results are indicated with *=P≤0.05 ** P≤0.01. Figure 1: Cytoscape interaction map generated from berberine. Red genes are downregulated, green genes are upregulated and yellow/blue indicates possible association and more research is needed. • Discussion • In silico analysis of the berberine array network indicates some interesting potential PXR interactions. • CDK2, 4 and 6 are downregulated by berberine, and are known to suppress the expression of PXR-regulated genes. • CDKN1A and CDKN1B are upregulated in response to berberine; this is known to be regulated by PXR directly. • MMP2 has previously been shown to be inhibited in response to UDCA, an FXR agonist and possible PXR agonist. • The vascular endothelial growth factor, VEGFA has been shown to be regulated by PXR in response to rifampicin, • The MTT results indicate that berberine is significantly cytotoxic at doses over 5 µM at 48 hours. Therefore doses of 1 and 5 µM were chosen to examine any gene expression changes. • The expected changes seen in expression of CYP3A4 were not observed in this system, likewise neither were CYP2B6 and SULT1A1. These genes are classical markers of PXR activity and their lack of observable change may indicate the PXR is not responsible for the gene changes observed in response to berberine. • Future Work • Using Rifampicin as a control. Using HepG2 and HepaRG cells. qPCR for gene expression. Reporter gene assays for a number of receptors. CHiPSeq to identify targeted promoter regions. B C A Figure 2a-e: Sections of the Cytoscape network isolated to highlight areas of interest. A) Cell growth, B) Growth Factors and Cytokines, C) Xenobiotic Metabolism, D) Cell Signalling and E) Apoptosis. As before, red genes are downregulated, green genes are upregulated and yellow/blue indicates possible association and more research is needed. E D