Australia at 23,000,000: Our Population Demographically Defined
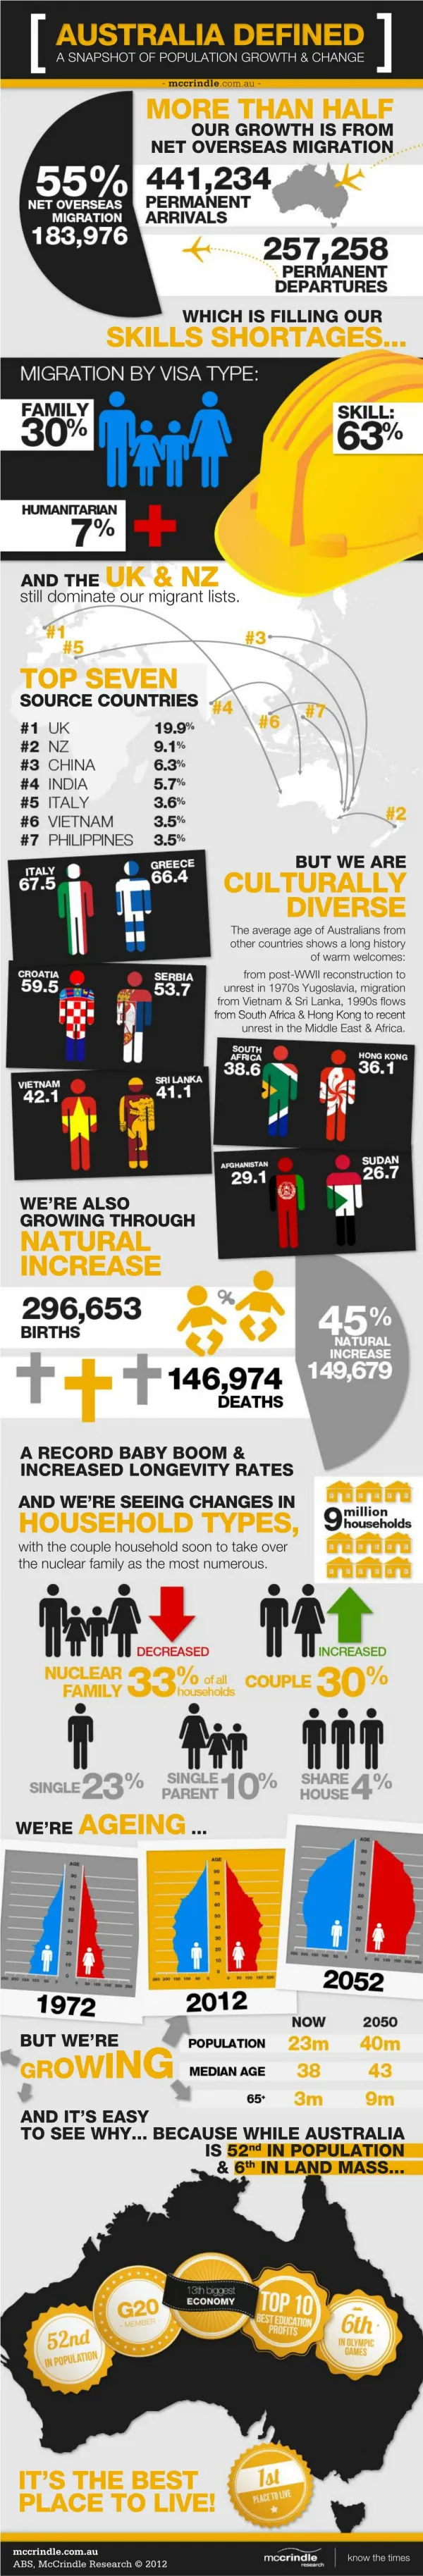
23 Million on 23 April 2013 Australia’s population growth has accelerated in recent months and will reach the population milestone of 23 million earlier than expected. With twice as many births as deaths, and with overseas migration arrivals having increased by 13.8% in a year, Australia is now growing by 1,048 people per day. Based on these current growth trends, Australia will hit 23 million at 9.57pm (AEST) on Tuesday 23 April 2013. Doubling the Population Australia’s population reached 11.5 million in 1966 and so it has taken less than 47 years to double to 23 million. The global population doubled at a slightly faster rate, hitting 3.5 billion in 1968 and reaching 7 billion in late 2011, a period of just over 43 years. Increasing Growth Rate: The latest demographic data from the ABS shows that Australia’s national population growth rate has increased from 1.6% to 1.7% per year. This is above that of the world (1.1%), well above China (0.5%), UK (0.6%), USA (0.9%) and even above countries that traditionally had high birth rates such as Vietnam (1.1%), India (1.4%) and Malaysia (1.6%). Big Numbers While an annual population growth rate of 1.7% doesn’t sound huge, it is well above the forecast of a decade ago (around 1%) and equates to a population increase equivalent to one new Canberra or three new Darwin’s per year. Record Births: Australia’s total fertility rate has risen each year over the last 3 years and is now 1.9. The total number of births continues to set new records and in the last 12 months has exceeded 300,000 for the first time ever (303,600). Twice as many Births as Deaths. While the birth rate has been growing, the death rate has been declining. The Standardised Death Rate (deaths per 1,000 population) has fallen to 5.59 (although the Individualised Death Rate is still 100%!) While total annual births exceed 300,000, annual deaths number 149,100. Population Growth from Migration exceeds that from Natural Increase. Permanent overseas arrivals are expected to break the half-million mark this year, falling just short of this at 488,100 in the last 12 months. Permanent departures rose slightly to 260,100 giving a Net Overseas Migration figure of 228,000, an increase of almost one-third (32.2%) on the previous year. The proportion of population growth contributed by migration has increased in a year from 54% to 60% and the proportion from natural increase has declined from 46% to 40%. Australia’s Ageing Continues: In just two decades Australia’s median age has increased nearly 5 years (from 32.7 to 37.5 today). In the last 5 years the proportion of our population aged under 20 has declined by a percentage point to be just 1 in 4 Australians (25%) while the proportion aged over 60 has increased by a similar amount to be 1 in 5 (20%). Based on these current demographic trends, by 2028, for the first time in Australia’s history there will be more people aged over 60 than aged under 20.