Download
1 / 30
300 likes | 448 Vues
Coal Valuation & Geographic Information Systems in West Virginia. Where we started & where we are today. State of the art coal map, circa 1980. State of the art coal owner “database”, circa 1980. Controversy over perceived inequities in coal

E N D
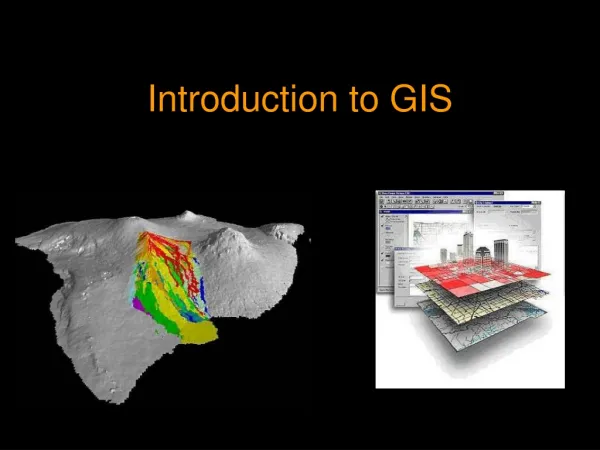
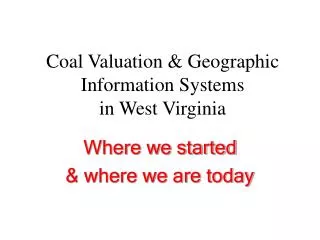
Coal Valuation & Geographic Information Systemsin West Virginia Where we started & where we are today
Controversy over perceived inequities in coal valuation for ad valorem property tax purposes led to a useful outcome, Executive Order 4-93, in 1993, which led to the creation of the Mineral Lands Mapping Program Initial funding was provided in 1995 by HB 2222.
Mineral Lands Mapping Program • Collaborative effort between WVDTR, WVGES, and WVU Department of Geology & Geography. • Purpose is to create a statewide GIS that is an accurate inventory of natural resource property. • This is an ongoing process with coal being the first resource mapped.
Digital Line Graphs are provided by the WVU Department of Geology & Geography’s GIS Technical Center. • Digital parcel mapping is done by Property Tax Division, Mineral Parcel Mapping Project. • Physiographic features such as streams & roads are used to reference parcel source maps to DLG’s. • Because of inherent problems in paper source maps this often requires “stretching” and “warping” of line work of surface parcels.
Ortho-photography also can reveal where parcel mapping needs correction. The parcels indicated by the blue arrow should obviously be located to the south-southwest.
All sources of parcel mapping are assembled into the “Big File” for use in each Tax Year. • Parcels can be stacked and coincident parcels may or may not be the same shape, interest, or ownership.
The WV Geological & Economic Survey creates coverages by coal bed for each 7.5-minute quadrangle in a county. • Point-source data from drill hole records & mine maps are used to create grids of various sorts including coal-only and coal-plus-partings • Previously mined areas are removed from the coverage to form a grid of remaining coal for each bed. • Coal bed grids are later converted to contours with mine barriers and buffers and low washability areas removed from remaining coal.
Contoured PGH with barriers, buffers, low washability areas removed
Where WVGES mapping has not yet become available, various data sources are used to create interim maps. Sources include WVGES, taxpayers, USBM, WVDEP, etc. Data are queried out by bed and used to create the necessary grids which are later contoured. Sometimes combinations of WVGES and interim mapping are used. • Data from the various sources are kept in the wvalldata table. For last year there were around 140,000 useful observations.
EAG coal bed with mining, indicated arcs, washability cuts, combination mapping.
EAG dry btu data points from wvalldata table and contour. 10265 to 14000
PGH dry sulfur data points from wvalldata table and contour. .94% to 7.06%
LKT dry volatility data points from wvalldata table and contour. 15% to 45%
Reserve Coal Valuation Model • This complex system is the legislatively mandated system for valuation of coal for property tax purposes. RCVM assumes that all the coal in the state has a unit value, arrived at as follows: Vaggr = (C$ ave )(ROY ave)(PROD ave)/Cap Rate The second important assumption is that the aggregate value minus total active value equals total reserve value.
RCVM determines value by determining the present value of a future royalty income stream. Items necessary for determining the future time of mining include locations of transactions (sales, leases, permit applications, etc.), current & past mining, oil & gas wells. All of these are mapped, as well as lease royalties, sulfur, btu, volatility, subjective environmental problems, in- place price/mmbtu.
Inspection is run against the various maps to “score” each coal bed on a property for: Market interest (transactions) Market mineability (# of mines) Prime coal bed factor Environmental conflict Use conflict (oil & gas) Volatility These are used to arrive at a final t-factor time) for valuation according to Formula 6 of the legislative rule governing coal valuation for ad valorem property tax purposes.
Formula 6 $/ac/bed=($/mmBTU)X(Roy)X[1±(BTU+S)]X[(1/(1+I)(t+0.5))x(1/106)]X(BTU)X(2000)X(1800)X(RR)X(Thk) Where: $/ac/bed = present value per acre of an individual coal bed on an individual property $/mmBTU = coal price (FOB-source) per million BTU Roy = average royalty rate [1 ± (BTU + S)] = BTU and sulfur adjustment factor 1/(1 + I)(t+0.5) = standard mid-year present worth factor (1/106) = 1 divided by 1,000,000 BTU = BTU content of one pound of dry coal by coal bed by location 2000 = two thousand lbs. per ton 1800 = 1800 tons per acre foot RR = clean coal recovery rate Thk = coal bed thickness in feet