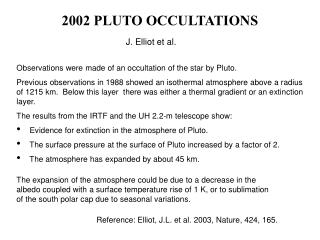
Deep Occultations With GRAS
250 likes | 385 Vues
Deep Occultations With GRAS. C. Marquardt, A.von Engeln and Y. Andres. Outline. Motivation GRAS Data Characteristics Deep Occultation Examples Attenuation and Maximum Bending Angle Gradients Conclusions. Deep Occultations.

Deep Occultations With GRAS
E N D
Presentation Transcript
Deep Occultations With GRAS C. Marquardt, A.von Engeln and Y. Andres
Outline • Motivation • GRAS Data Characteristics • Deep Occultation Examples • Attenuation and Maximum Bending Angle Gradients • Conclusions
Deep Occultations During the last (October 2009) FORMOSAT-3/COSMIC Workshop, Sergey (see Sokolovskiy et al., 2010, Radio Science) made us aware that... …signals from strong bending in the lower troposphere may be found at SLTAs below -150 km …neglecting deep occultation signals may cause systematic negative biases in the lower tropospheric retrievals …including noise from very low SLTAs may cause systematic positive biases A number of questions remained: Can GRAS get deep occultation signals at all, given that it requires code tracking for raw sampling (and had a lower SLTA limit @ -145 km at the time)? How far down does atmospheric information spread / do we need to track RO signals? How weak can these signals become - what sensitivity must (future) RO receivers have? Are there (fundamental?) limits to our ability to observe strong bending angle (gradient)s due to the measurement principle (which is correlation against imperfectly orthogonal codes)? Is signal amplitude a reliable indicator for atmospheric information?
Deep Occultations with GRAS In December 2009 (10th - 16th Dec.), we modified GRAS to do raw sampling measurements down to – 300km SLTA. This presentation provides an analysis of the information contained in deep occultation measurements obtained with GRAS statistics from 5 days (11th -15th December 2009) selected examples from 14th December 2009 In October 2010, we permanently changed the GRAS configuration to track down to -250 km SLTA.
GRAS Measurement Modes (and Consequences) • Dual Frequency Carrier Tracking: code and carrier for L1 and L2 are tracked; both (+ C/A) are reported @ 50 Hz • Single Frequency Carrier Tracking: C/A code and carrier phase are tracked; C/A code and carrier are reported @ 50 Hz • Single Frequency Raw Sampling: C/A code tracked, 1 kHz sampling of carrier • Either L2 or RS due to hardware constraints • CL data gaps in rising occultations which are currently not covered by RS data • SF carrier tracking and raw sampling can occur simultaneously • GRAS requires the C/A code being tracked even in raw sampling mode • Loss of C/A code tracking during raw sampling causes data gaps in most occultations • Range model is used internally to aid C/A code acquisition, but the receiver doesn’t rely on it for measurements (which might be overly pessimistic) • Re-acquisition latency is in the order of 1 sec
Meridional Penetration (10/2007) • Meridional density distribution of lowest SLTA for RS data segments longer than 0.2 sec • Occultations reach deeper in the tropics… • …and data is clearly cut-off prematurely at -145 km SLTA at low latitudes • There’s an interesting feature for rising occultations around the cut-off altitude (-145 km SLTA)
Meridional Penetration (Dec 2009) • Meridional density distribution of lowest SLTA for RS data segments longer than 0.2 sec • Same pattern for setting and rising occultations ending/beginning above -200 km SLTA… • …an additional feature at very low SLTAs for rising occultations.
Penetration down to -200 km SLTA (setting, spectra) • There is information in GRAS data for SLTAs below the then current (-145 km SLTA) cut off • Is the low SLTA information always related to the atmosphere?
Penetration down to -200 km SLTA (setting, cont’d) • Diagonal lines indicate cross-PRN C/A code correlations in the correlations… • …which so far we mainly used to advertise GRAS’s high sensitivity
PRN Cross-Correlations GPS (and other GNSS systems) distinguish signals from different satellites by correlating a satellite specific replica code with the observed signal (which has this code modulated on top of the carrier frequency) For raw sampling / open loop data, this is the L1 C/A code Nominal maximum cross-correlations between C/A codes from different PRNs are in the order of -24 dB, varying with doppler offset (can be as large as -21 dB) This is no problem if the measured atmospheric signal is stronger than any PRN cross-correlations
Penetration down to -200 km SLTA (setting, cont’d) < -30 dB for signal
Penetration down to -200 km SLTA (setting, spectra) • There is information in GRAS data for SLTAs below the then current (-145 km SLTA) cut off • Is the low SLTA information always related to the atmosphere?
Penetration down to -200 km SLTA (setting, cont’d) • Is the low SLTA information always related to the atmosphere? • Well – probably both no (left) and yes (right)
Penetration down to -200 km SLTA (setting, cont’d) -30 dB for cross tracking -30 dB for signal
Penetration below -200 km SLTA setting rising rising
Penetration below -200 km SLTA setting rising rising
Penetration below -200 km SLTA (setting) • Doubtful if “signal” below -200 km SLTA is related to atmosphere, even in this case... • Signal attenuation in deep occultations quickly becomes as low as cross-PRN tracking events; is this a fundamental limit for the observation of deep occultations?
Penetration below -200 km SLTA (rising) • Data below -200 km in rising occultations was related to cross-PRN tracking in all other cases analysed... • ...strongly suggesting that there might not be much information on atmospheric occultations below -200 km SLTA
Meridional Penetration (Dec 2009, once more) • Atmospheric signal above –200 km SLTA • PRN cross tracking below
Attenuation Statistics • Boxplot… • …for rising… • …and setting occultations • Not sure if I completely understand this yet…
Attenuation and Bending Angle Gradients Assuming defocussing as main mechanism for signal attenuation, attenuation is (approximately) Strongest bending occurs on top of bending angle spikes; typical values for GRAS (L = 3300 km): Smoothing in retrievals further reduces resolvable gradients (and thus max bending angle values)
Conclusions Can GRAS get deep occultation signals at all, given that it requires code tracking for raw sampling? Yes. How far down does atmospheric information spread / do we need to track RO signals? GRAS: down to -200 km SLTA; everything below are very likely PRN cross-correlations (or so weak that they cannot be observed by GRAS) Signals can become weaker than PRN cross-correlation already at -150 km SLTA How weak can these signals become - what sensitivity must (future) RO receivers have? GRAS data: - 30 dB attenuation (or more), i.e. in the order of or below PRN cross correlation level Some evidence for GRAS noise level around - 40 dB Are there fundamental limits to our ability to observe strong bending angle (gradient)s? Receivers w/o showing PRN cross correlations: may miss lowest part of deep occultations, limiting the ability to measure steep bending angle gradients on top of large bending angle ‘spikes’. 50 Hz limitation? Receivers w/ PRN cross correlations: require separation of atmospheric and cross PRN signal contributions Is signal amplitude a reliable indicator for atmospheric information? No, because cross-correlation events cannot be distinguished by amplitude data alone
Attenuation Statistics • Boxplot… • …for rising… • …and setting occultations • Not sure if I completely understand this yet…